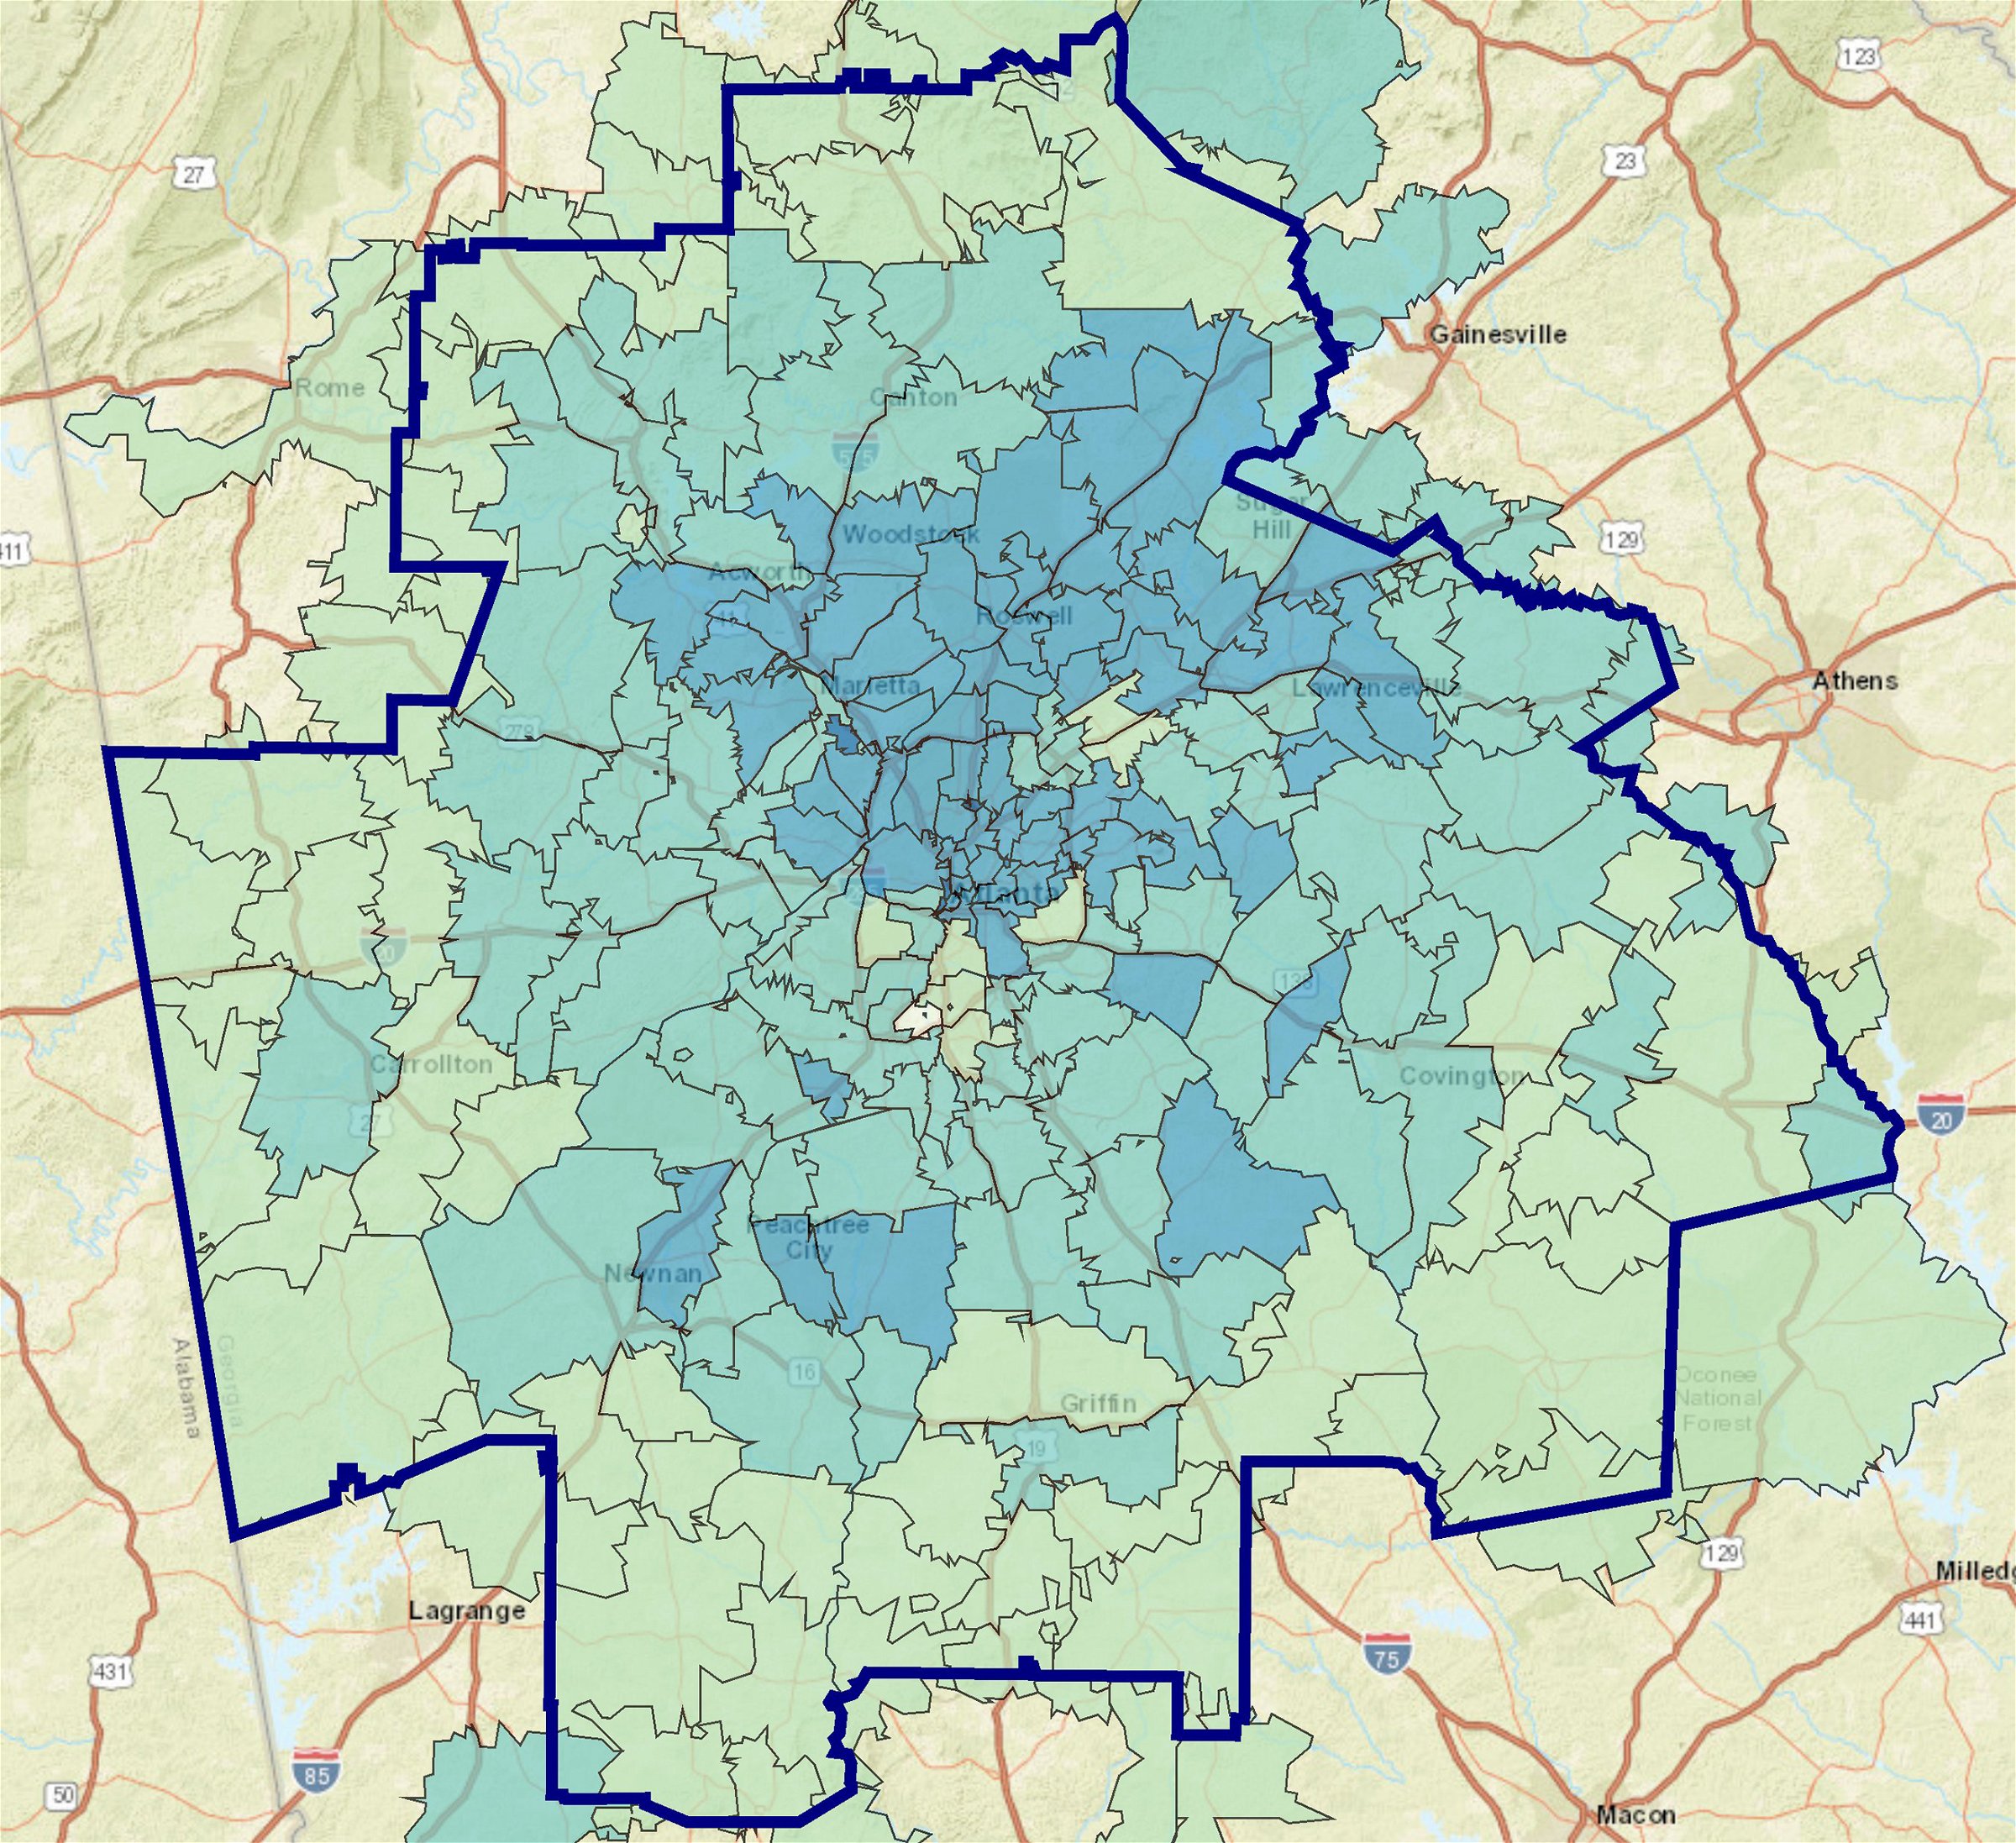
This week’s Monday Mapday explores time spent online in the Atlanta metropolitan statistical area (MSA). The map below shows the percentage of the adults,* by zip code, that spent an average of 2 to 4.9 hours online in a typical day. Areas shaded in dark blue (including areas of Cherokee, Cobb, DeKalb, Fayette, Forsyth, Fulton, and Gwinnett counties) had the highest percentages of adults that reported spending 2 to 4.9 hours online, with zip code 30322 (located near Emory University) approaching nearly 43 percent. Areas shaded in lighter green shades represent those with the lowest percentage of adults spending 2 to 4.9 hours online.
Percentage of Adults Who Spent 2 to 4.9 Hours Online in a Typical Day, 2017

Source: ESRI Business Analyst Online and GfK MRI, 2017 Internet (Market Potential)
Note: There are many individuals who spend greater than 4.9 hours online in a typical day, just as there are users who spend less than 2 hours online. However, when looking at the data for all time range categories, the highest percentage of internet users in the metro area fell into the 2-4.9 hour range.
And, just for fun, the map below depicts the percentage of adults,* by zip code, who visited an online blog (like 33N!) in the last 30 days. Again, dark blue shades represented the zip codes with the highest percentage of blog readers, while lighter green shades represent those zip codes where adults are least likely to have visited a blog in the last 30 days.
Percentage of Adults Who Visited an Online Blog in the Last 30 Days, 2017


