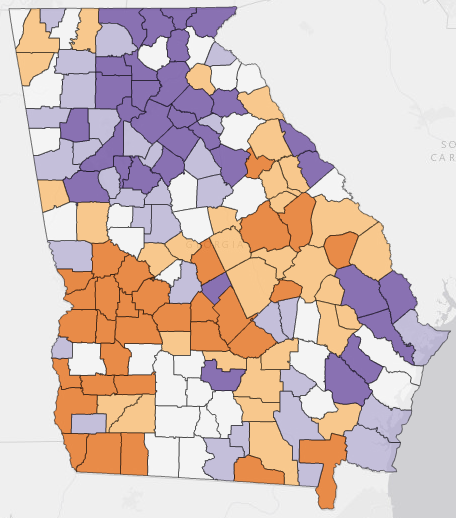
Friday Factday: High School Graduation
For today's Friday Factday, we take a look at spatial patterns in high school graduation across metro Atlanta. For more information, visit Neighborhood Nexus at https://neighborhoodnexus.org.

For today's Friday Factday, we take a look at spatial patterns in high school graduation across metro Atlanta. For more information, visit Neighborhood Nexus at https://neighborhoodnexus.org.
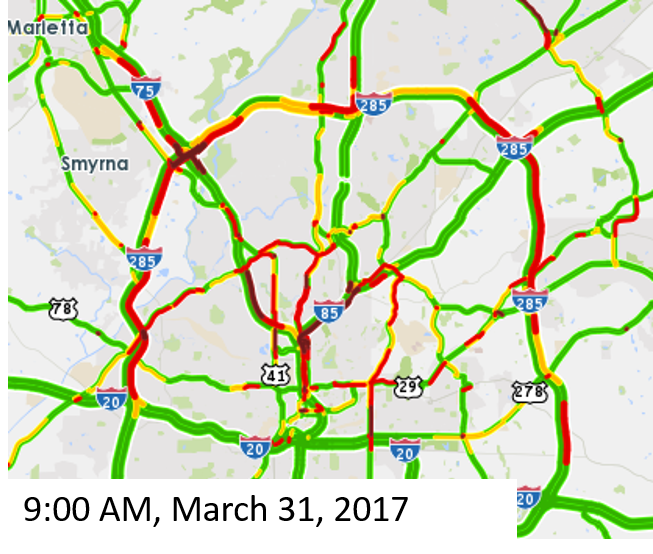
Following the fire and bridge collapse on I-85, commuters are changing their travel patterns. Many metro Atlanta residents may choose to take transit or stay home today, alleviating congestion on roadways, but for those still driving, here is a look at traffic on the major roadways on Friday, March 31. Check back for updates. [...]
The most recent county-level data from the Census Bureau (2016 Population Estimates, released last week) allow us to analyze ttrends in county, metro, and state population numbers. A new article from Governing shows that urban counties in the Northern U.S. and Midwest have slowed in their rates of population growth, and in some cases [...]
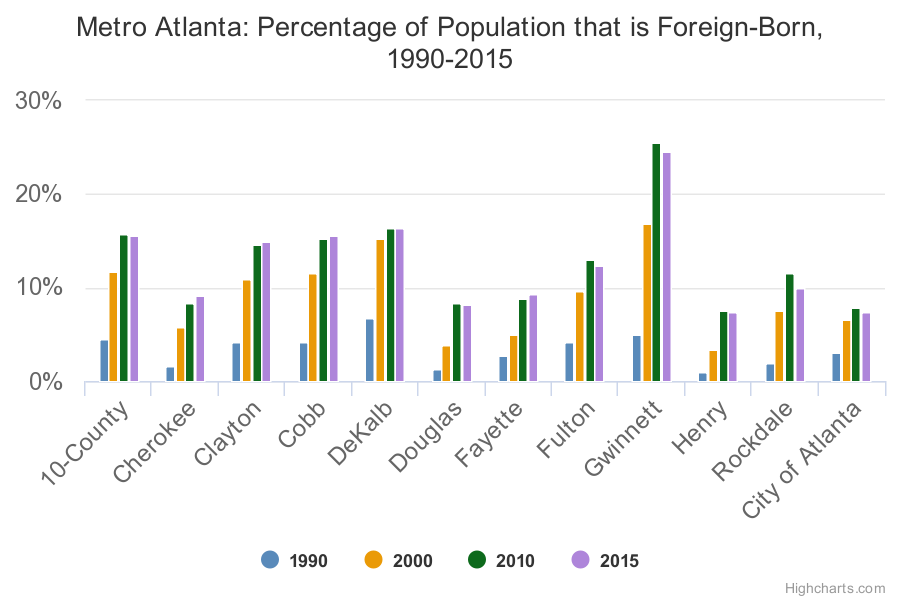
As part of the kick-off for Atlanta Regional Commission’s New Voices: Global Advisory Panel we are sharing updated data about trends in the foreign-born population for metro Atlanta. These charts serve as an introduction to a larger snapshot that will look at the diversity of residents within the foreign-born population; check back for more [...]
Happy St. Patrick's Day! To celebrate the greenest day of the year, this Friday Factday looks at Irish-American heritage and economic connections in metro Atlanta and Georgia. For national-level trends, check out the U.S. Census Bureau Facts for Features page.
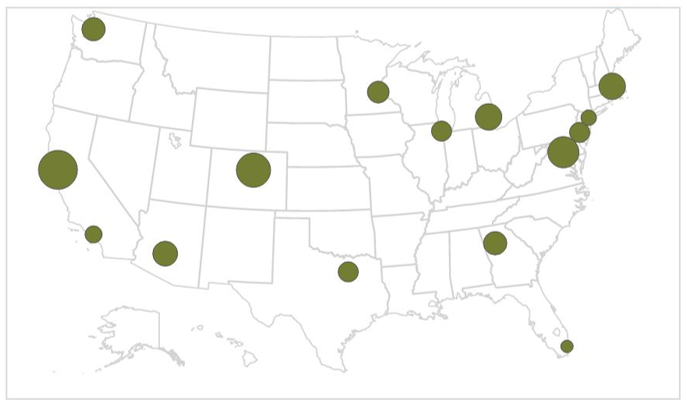
Our recent Regional Snapshot: Digital Skills- Through the Burning Glass uses Burning Glass Labor Insight data to assess job postings seeking general digital and advanced digital skills– at national, peer metro, and Atlanta metro levels. This map shows the top 15 hiring regions (MSA) for jobs seeking candidates with digital skills over the last 12 [...]
The charts below show selected health metrics for each of the counties in the 20-county region, as well as 10-county and 20-county aggregations. Numbers are provided for the following: Percentage of population without health insurance (an average of years 2011-2015) The cause of discharges from hospitals by chronic disease type (rate is per 100,000 [...]
What and How Important Are Digital Skills? The March 2017 Regional Snapshot uses Burning Glass Labor Insight data to assess numeric trends and demand characteristics of job postings seeking general digital and advanced digital skills-- at national, peer metro, and Atlanta metro levels. Highlights: In Atlanta for 2016, 65 percent of postings (about 367,000) [...]
Fayette County residents are concerned about transportation, but increasingly optimistic about economic conditions. While residents have a great sense of safety and quality of life in their neighborhoods, they are a little less optimistic than all survey respondents about a better near-term future for the region as a whole. Check out some highlights of the [...]
In the 10-county metro region, 15.8 percent of the population lives below the poverty line (see the income tab on the 20-County Data Dashboard, 2011-2015 American Community Survey 5-Year Estimates). Using the Georgia Cities mapping tool on Neighborhood Nexus we can see what this trend looks like in Georgia cities. Two sets of cities [...]