Regional Snapshot: 100 Metros Data Dashboard
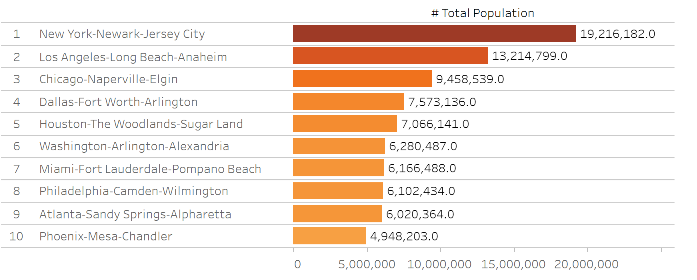
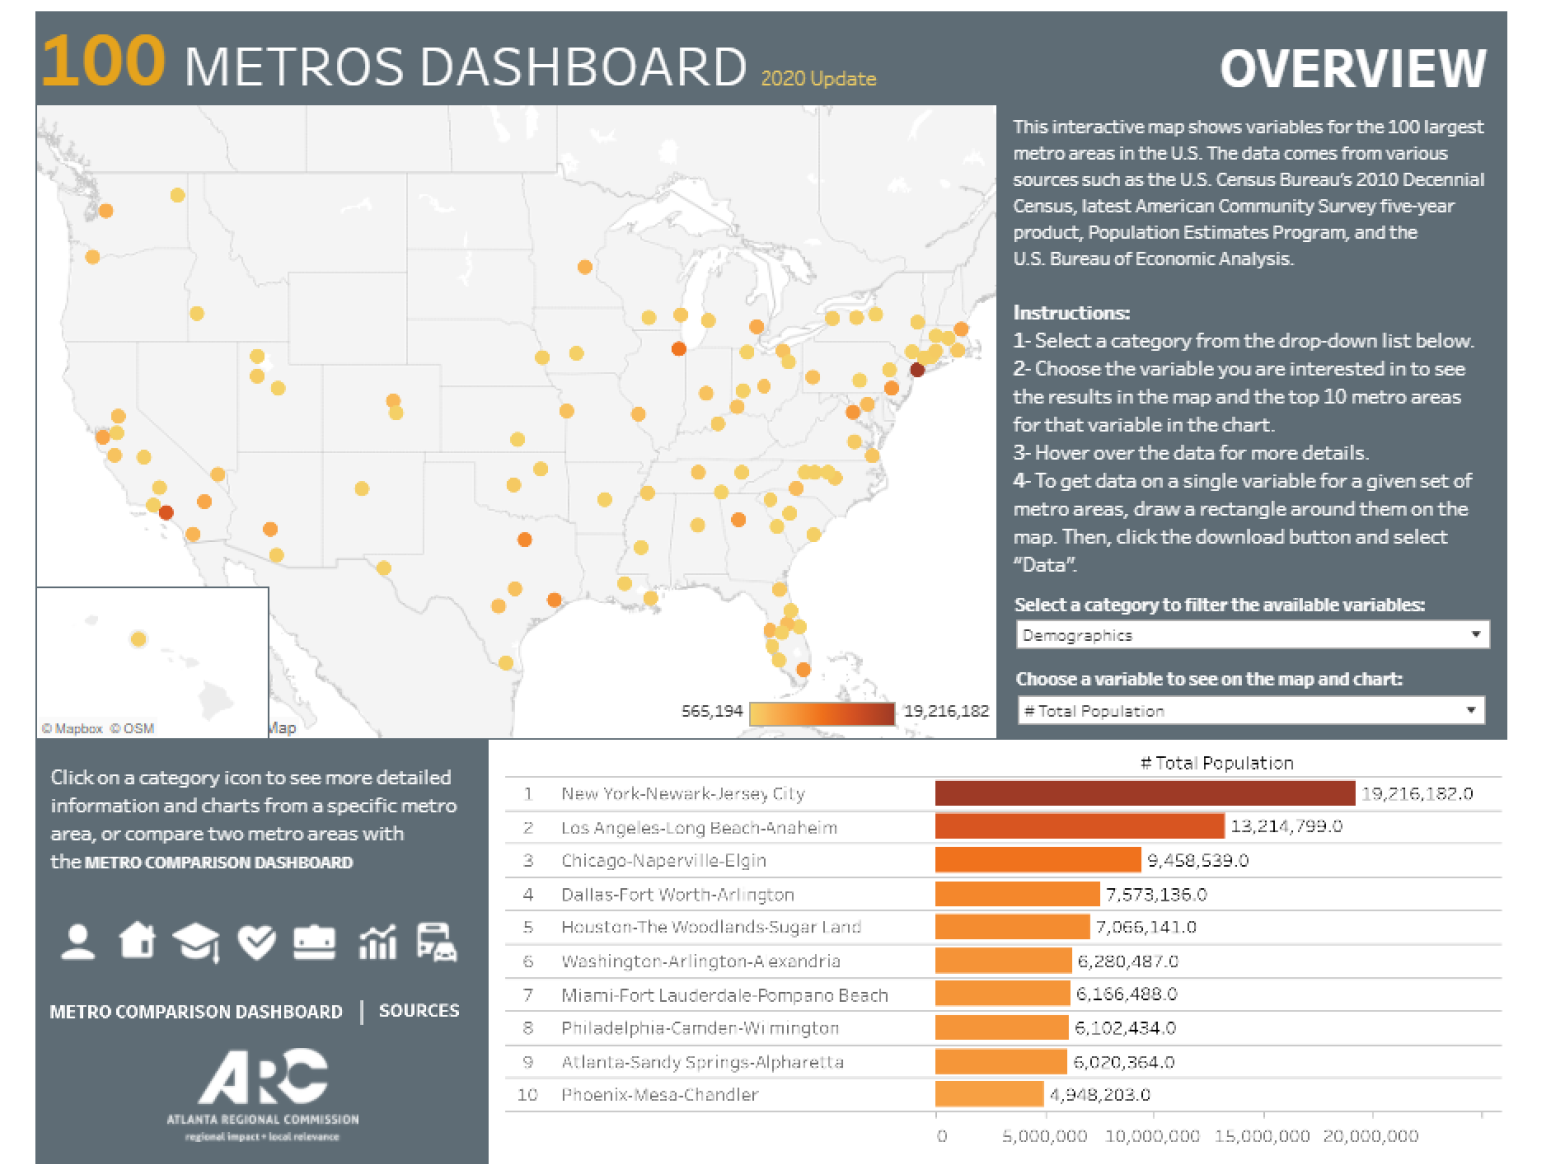
This month's regional snapshot introduces our updated 100 Metros dashboard, with an overview of some select findings and a demonstration of the comparison feature.

This month's regional snapshot introduces our updated 100 Metros dashboard, with an overview of some select findings and a demonstration of the comparison feature.
A comparison of jobs between Q1 and Q2 of 2019 and 2020, and a look at unemployment rates in the course of 2020, reveal the depth of the pandemic's impact on our economy.
Job loss in Atlanta was bad (and our recovery is slow)--but it was worse by many other measures in many other places.
A quick look at what we learned using the Atlanta Fed's Mortgage Analytics and Performance Dashboard.
This month's regional snapshot presents an updated overview of public health and economic indicators from this persistent (and surging) pandemic.
A new U.S. Census mapping product examines the percent difference in state tax revenue streams between 2019 and 2020.
Prior to the COVID pandemic, students in the metro Atlanta region were making progress in 3rd grade literacy, with rates of students proficient and above increasing 5 percentage points between the 2017-2018 and 2018-2019 academic years. For Black and Latinx students the percentage of students proficient and above in 3rd grade literacy increased by 5 and 4 percentage points respectively. The pandemic’s impact on our education and social structures, however, is threatening these gains.
The latest information on cases and the economic impacts in ARC's 10-county area.
A dashboard of school enrollment shows that most metro school districts have seen a drop in numbers.