Concerns about children’s schooling have touched on every part of the pandemic, and nationally, educators are seeing a drop in school enrollment.
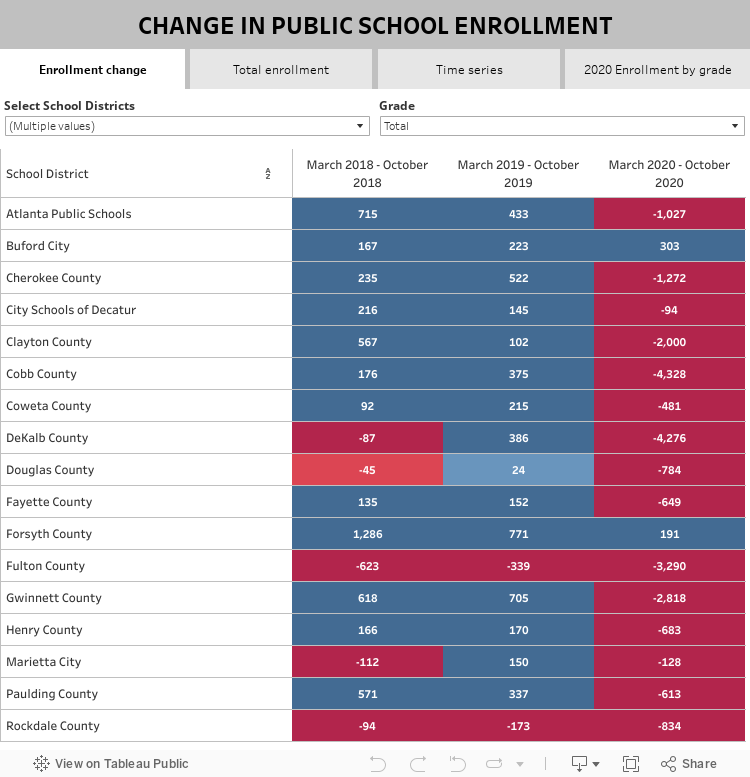
The dashboard below compares enrollment numbers from March through October in 2018, 2019 and 2020. The big picture? Locally, with rare exception, we’ve followed the national trend and seen our enrollment numbers drop in 2020.
While the dashboard is set to examine enrollment in the metro area, you can use the tool to look at any school district in Georgia using the “Select School Districts” drop-down menu. Want to focus on change in a specific grade level? Use the “Grade” menu on the right. Tabs at the top indicate what enrollment data you can examine. For a chart view (which shows just how dramatic the change is), click on the “Time series” tab at the top.