Monday Mapday: Job Density Change
A nationwide and statewide look at job density and job density change over time.

A nationwide and statewide look at job density and job density change over time.
This Monday Mapday considers the geographic concentration of multifamily housing across ARC's 21-county metro.
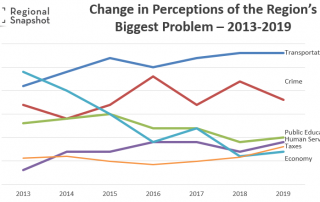
This month's regional snapshot presents summary findings for ARC's 2019 Metro Atlanta Speaks Survey, providing a detailed slide deck and a link to a really great Tableau data dashboard .
Our most recent update of The Quarter analyzes economic data in metro Atlanta for Q2 2019. The Quarter includes data on employment, home price indices, building permits, retail and office space, and more, with the goal of identifying what areas of our economy are striving and what areas are slower to recover. Visit The [...]
An overview of disparities in homeownership across the metro.
It may not quite feel like sweater weather yet, but the metro's fall colors are ready to signal it's time to don a cozy cardigan.
How does Georgia stack up when it comes to shares of Native American and Alaska Native peoples? These maps take a look at these shares, by tract and county, across the country and the state.
Breast cancer awareness month is upon us. This post considers what percent of state and metro-area deaths are a result of the disease, as well as how much it contributes to premature death and racial disparities in this worst-case outcome.
Coupling data about current median wages and future job opening projections, this Friday Factday considers what occupations have a rosy outlook in the state of Georgia through 2026.
Travel back to 1949 using this City of Atlanta Department of City Planning map.