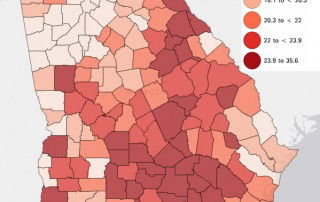
Friday Factday: Supplemental Nutrition Assistance Program (SNAP) in Georgia
Formerly called the Food Stamp Program (FSP), the Supplemental Nutrition Assistance Program (SNAP) provides dietary assistance to low-income individuals and families through the distribution of food purchasing vouchers (in the form of EBT cards since 2004) redeemable at authorized retailers in the United States. The funding for SNAP is currently authorized through the Agricultural [...]