
Formerly called the Food Stamp Program (FSP), the Supplemental Nutrition Assistance Program (SNAP) provides dietary assistance to low-income individuals and families through the distribution of food purchasing vouchers (in the form of EBT cards since 2004) redeemable at authorized retailers in the United States. The funding for SNAP is currently authorized through the Agricultural Act of 2014, also known as the Farm Bill. The bill expires this year, and its replacement is at this moment being debated in the U.S. Congress, with particular focus on a provision that would add “work requirements” to participation in the program. With this in mind, we thought it might be helpful to provide our readers with a few facts about the program in the State of Georgia.
Of the 14% of Georgia households receiving SNAP benefits in 2016...
| 44% included one or more persons with a disability. |
| 55% included one or more children under 18 years old. |
| 80% included one or more persons working in the past 12 months. |
Date source: U.S. Census Bureau, American Community Survey (ACS), 1-year estimates, 2016
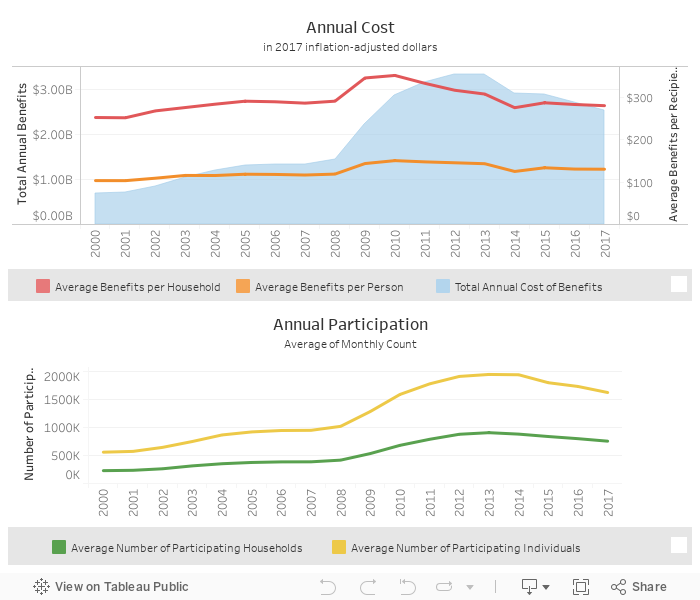
The chart below, created using data from the United States Department of Agriculture (USDA) which oversees SNAP, provides a picture of how participation and benefit amounts have changed between 2000 and 2017. With household income being the primary driver of participation in the program, the number of individuals and households receiving benefits is closely related to the economy of the country overall. When incomes are down, participation in the program increases. The large increase during the Great Recession is a clear example of this relationship. On an individual and household level, the amount of benefits for which each recipient is eligible is determined primarily by how far under or over the poverty line one falls. As such, in addition to shifting policy, the average amount of income earned by recipients can impact the average benefits and total program expenditures. As participation in SNAP in Georgia has declined beginning in 2014, so too have the total annual benefit amounts declined, even as the average benefit per participant has remained roughly the same.
SNAP Costs & Participation in Georgia, 2000 to 2017
Hover over the charts below to view an explanation of the data points.
Click here for mobile-friendly version.
Date source: U.S. Department of Agriculture (USDA), Food and Nutrition Service, 2000 to 2017