Regional Snapshot: Weathering the Workforce Waves

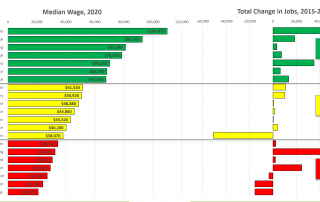
This month's regional snapshot provides a detailed overview o workforce conditions, with close looks at overall demographic and earning characteristics of ARC 10-County Region workers, as well as at job trends by period for (and profiles of) training-targeted high demand clusters

By |2021-04-29T10:15:10-04:00April 29th, 2021|Economic Development, Economy, Regional Snapshot|Comments Off on Regional Snapshot: Weathering the Workforce Waves

Exploring Pandemic Employment Outcomes

Taking a closer look at ways in which data from Metro Atlanta Speaks and other survey sources reveal the economic damage of the pandemic while finally indicating signs of at least an overall recovery.

By |2021-04-15T21:54:23-04:00April 15th, 2021|Data Diversions, Economic Development, Economy, Equity, Race and Diversity|Comments Off on Exploring Pandemic Employment Outcomes

CareerRise Economic Mobility Dashboard: Clusters of Opportunity

Explore our new occupation demand and supply data dashboard, which focuses on the economic health and workforce characteristics of the ARC WorkSource Plan's five target occupation clusters.

By |2021-04-09T15:40:19-04:00April 9th, 2021|Data Diversions, Economic Development, Economy, Equity, Friday Factday, Race and Diversity|Comments Off on CareerRise Economic Mobility Dashboard: Clusters of Opportunity

Regional Snapshot: 100 Metros Data Dashboard

This month's regional snapshot introduces our updated 100 Metros dashboard, with an overview of some select findings and a demonstration of the comparison feature.

By |2021-02-11T10:52:55-05:00February 11th, 2021|Economic Development, Economy, Population, Regional Snapshot|Comments Off on Regional Snapshot: 100 Metros Data Dashboard

The difference a year (and/or a quarter) makes: Jobs and unemployment
2019 vs. 2020

A comparison of jobs between Q1 and Q2 of 2019 and 2020, and a look at unemployment rates in the course of 2020, reveal the depth of the pandemic's impact on our economy.

By |2021-02-08T18:52:29-05:00February 8th, 2021|COVID-19, Economic Development, Economy, Monday Mapday, Uncategorized|Comments Off on The difference a year (and/or a quarter) makes: Jobs and unemployment
2019 vs. 2020

The Atlanta MSA Job Base: How Low (Relatively) Did We Go…or Not?

Job loss in Atlanta was bad (and our recovery is slow)--but it was worse by many other measures in many other places.

By |2021-02-10T12:27:20-05:00February 4th, 2021|COVID-19, Data Diversions, Economy|Comments Off on The Atlanta MSA Job Base: How Low (Relatively) Did We Go…or Not?

Regional Snapshot: A Take on the Pandemic Economy

This month's regional snapshot presents an updated overview of public health and economic indicators from this persistent (and surging) pandemic.

By |2021-01-15T17:12:12-05:00January 15th, 2021|COVID-19, Economy, Public Health, Regional Snapshot|Comments Off on Regional Snapshot: A Take on the Pandemic Economy

Monthly Sales Tax Collections Around the Country, 2019 vs. 2020

A new U.S. Census mapping product examines the percent difference in state tax revenue streams between 2019 and 2020.

By |2021-01-11T15:29:37-05:00January 11th, 2021|Economy, Monday Mapday|Comments Off on Monthly Sales Tax Collections Around the Country, 2019 vs. 2020
Go to Top