Monday Mapday: Job Density Change
A nationwide and statewide look at job density and job density change over time.

A nationwide and statewide look at job density and job density change over time.
This Monday Mapday considers the geographic concentration of multifamily housing across ARC's 21-county metro.
Charts and maps taking a look at our rates of veterans across the country and statewide.
Our most recent update of The Quarter analyzes economic data in metro Atlanta for Q2 2019. The Quarter includes data on employment, home price indices, building permits, retail and office space, and more, with the goal of identifying what areas of our economy are striving and what areas are slower to recover. Visit The [...]
It may not quite feel like sweater weather yet, but the metro's fall colors are ready to signal it's time to don a cozy cardigan.
Driving alone remains the commuting option of choice for the 10-county metro, but its rates vary by location and occupation.
How does Georgia stack up when it comes to shares of Native American and Alaska Native peoples? These maps take a look at these shares, by tract and county, across the country and the state.
How many children are born into families with at least one foreign-born parent in Georgia? This Monday Mapday looks at the data by county and how things have changed since 2010.
Coupling data about current median wages and future job opening projections, this Friday Factday considers what occupations have a rosy outlook in the state of Georgia through 2026.
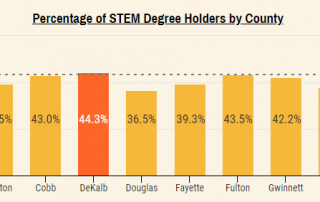
An analysis of STEM majors in the 10-county Atlanta metro area, broken down by gender and race.