

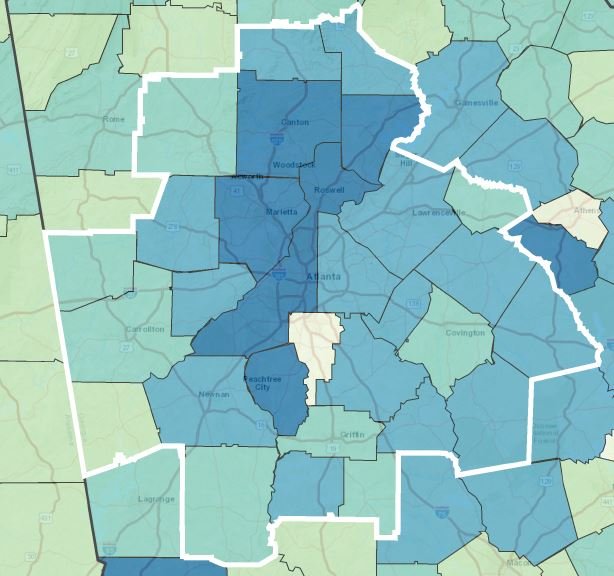
Monday Mapday: Home Sale Price Changes by Zip Code
When viewed at the zip code level, average home sale listing prices between 2012 [...]

Friday Factday: Manufacturing Employment vs. Output
Last month, Pew Research Center released an article highlighting national growth in manufacturing output [...]
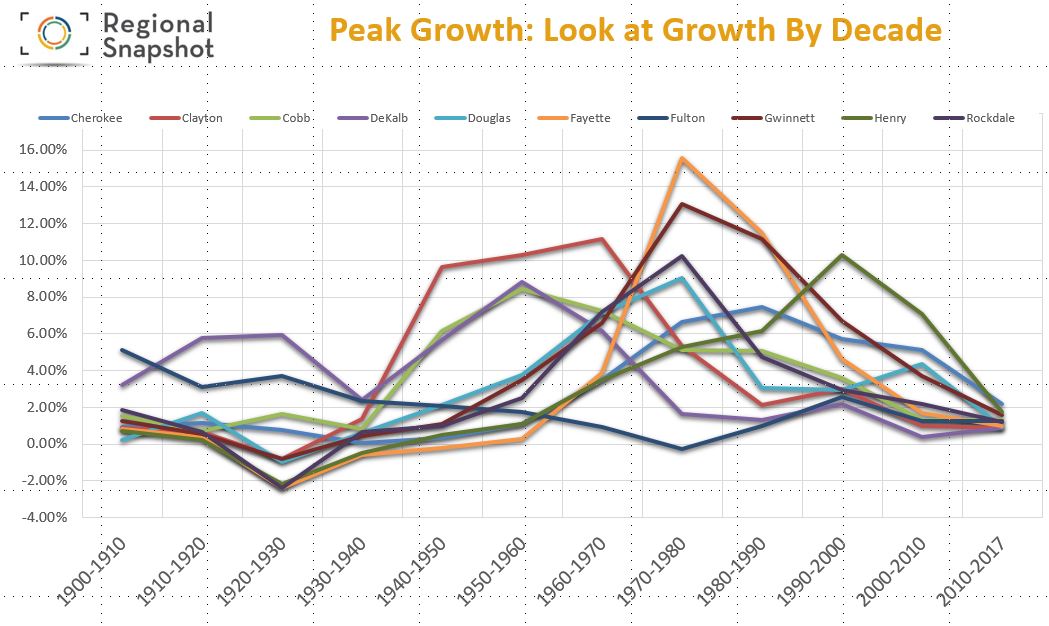
Regional Snapshot: 2017 Population Estimates
It’s that time of year again! Today ARC releases its 2017 Population Estimates. How [...]

Monday Mapday: Diversity in Metro Atlanta Region
ESRI's diversity index provides an estimate of how likely two people, selected at random [...]

Friday Factday: Georgia Milestones Results and Trends
The Georgia Department of Education (GA DOE) recently released the Georgia Milestones results for [...]

Regional Snapshot: Affordable Housing
Overall, Atlanta is an affordable place... or is it? Housing affordability is a concern, [...]
Monday Mapday: Regional Health Care Costs
This map shows average health care costs, by county, in the Atlanta metropolitan statistical [...]

Friday Factday: Anniversary of Americans with Disabilities Act
July 26, 2017 celebrates the 27th anniversary of the Americans with Disabilities Act (ADA), [...]

Monday Mapday: Atlanta Rents on the Rise
In keeping with the housing affordability theme, today's Monday Mapday explores metro Atlanta's rental [...]

The Quarter: Highlights from Q2 2017
Our most recent update of The Quarter analyzes economic data in metro Atlanta for [...]