

Friday Factday: Homeownership and Household Formation Among Millennials
Nationally, the country is experiencing a delay in household formation among the millennial generation, [...]
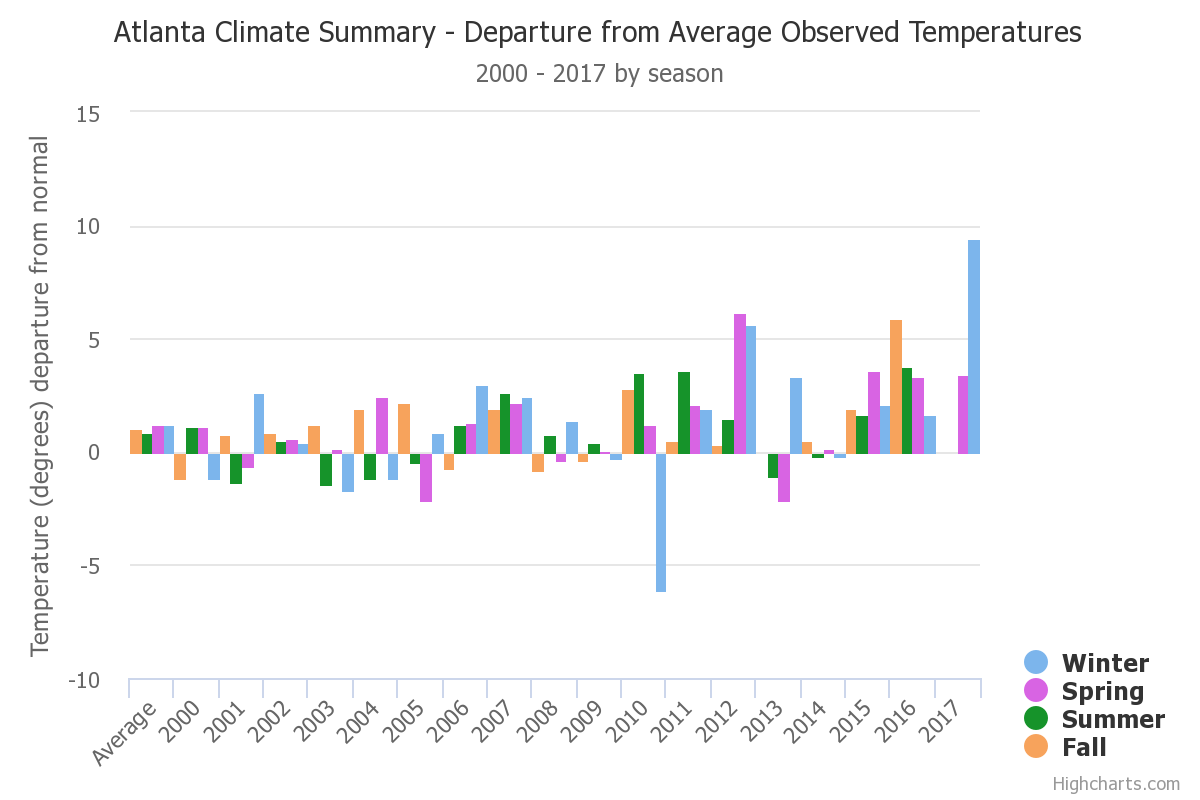
Hotlanta: Temperature Changes 2000-2017
Update through June, 2017: June 2017 was the first month with a below [...]

Friday Factday: ARC’s BIG Move
On June 19th, 2017 ARC moved from its home of nearly 17 years at [...]

Regional Snapshot: Arts & Culture
Beyond increasing our quality of life and enriching our culture, the Arts have a [...]

Monday Mapday: Population with No Health Insurance Coverage – 100 U.S. Metros
This map compares the most recent healthcare coverage data from the U.S. Census Bureau [...]

Friday Factday: Spending and Jobs Supported by Nonprofit Arts and Culture Industry
The recently released Arts and Economic Prosperity 5 Study by Americans for the Arts [...]

Monday Mapday: Location of Low-Income Workers vs. Low-Income Jobs
The maps below show a spatial mismatch between the location of low-income workers and [...]
Monday Mapday: Transportation Costs Complicate Affordability
How do transportation costs factor into affordable housing? When considering both housing and transportation [...]

Most and Least Affordable Areas for Housing Costs
A recent CityLab article highlights the nationwide challenge to afford housing. In very few areas [...]
Monday Mapday: Change in Low Birthweight Births
This map shows the areas (by Census Tract) that have had the greatest increase [...]