

Emma Willard: America’s first female cartographer
This International Women’s Day, we're honoring Emma Willard (February 23, 1787–April 15, 1870). First and [...]

Money Talks: Women’s and Men’s Earnings
A look at women's earnings as a percent of men's, using 2015-2019 American Community Survey rolling averages.

The Income Incidence of a Cost Crisis (in Housing)
About a third of Atlanta households are defined as cost-burdened (spending more than 30 percent of income on housing). BUT those cost burdens go up...a lot...for renters, for lower-earners, or (especially) for lower-income renters.

Happy Birthday, W.E.B. Du Bois
Celebrating the life of the incomparable W.E.B Du Bois through a series of maps and charts that show just how long the arc of data visualization history in Georgia actually is.

Housing Insecurity in the Time of COVID-19: Evidence from Two Surveys
Data from two surveys show that housing affordability worries are all too real for Atlantans, and are growing despite initial policy efforts.

Black Educational Attainment: A Half-Century of Pronounced Progress
The Atlanta Black population's higher educational attainment has soared over the last fifty years. The share of Black higher ed degree holders has grown by 500 percent since 1970, besting the related share in the rest of the population, which grew by 350 percent.

Black-Owned Businesses: An Atlanta Growth Engine
Black-owned businesses make up a much larger share of the Atlanta metro business base than they do at the national level, and a relatively large share of these businesses are small.

Atlanta Metro Eviction Tracking Update, February 2021
Updates to the status of evictions in five metro counties, plus details about the national context and local assistance efforts.

Change in Share: Georgia’s Non-Hispanic Black Residents, 2010-2018
Interactive maps taking a look at how the distribution of Georgia's Non-Hispanic Black population has changed since 2010.
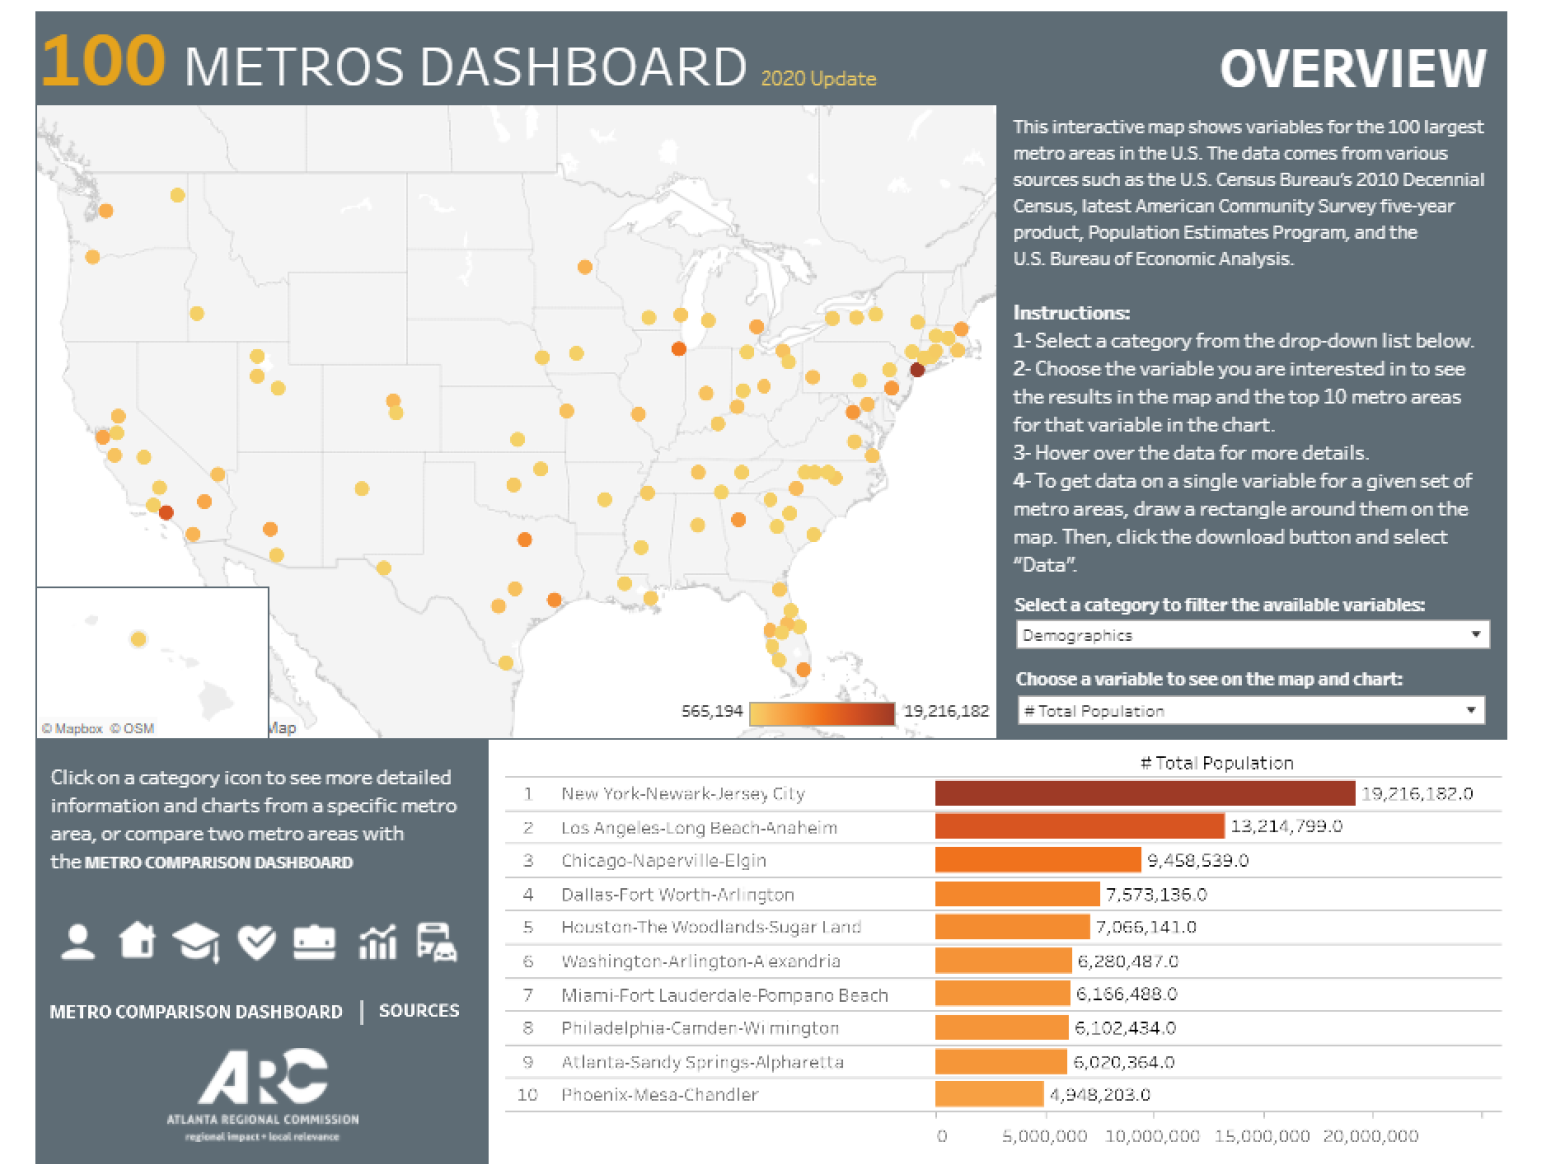
Regional Snapshot: 100 Metros Data Dashboard
This month's regional snapshot introduces our updated 100 Metros dashboard, with an overview of some select findings and a demonstration of the comparison feature.