
Monday Mapday: Declining Share of 65 Plus Population
In (Most) Core Urban Areas in Region
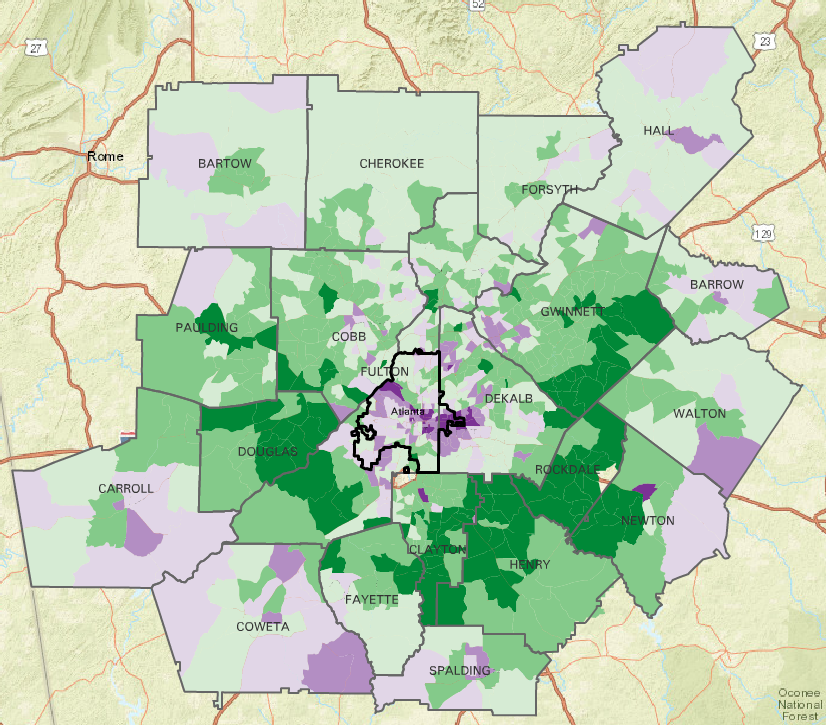
The Atlanta Metro region as a whole experienced widespread growth in the proportion of residents that is 65 years and over between 2000 and the most recent American Community Survey (ACS) 5-year estimates (2012-16). The map below shows the areas with the greatest change in proportion in dark purple and areas of more modest growth [...]
Friday Factday: Perceptions of Our Biggest Problem–Atlanta and the State
A Stroll Through Different Polls
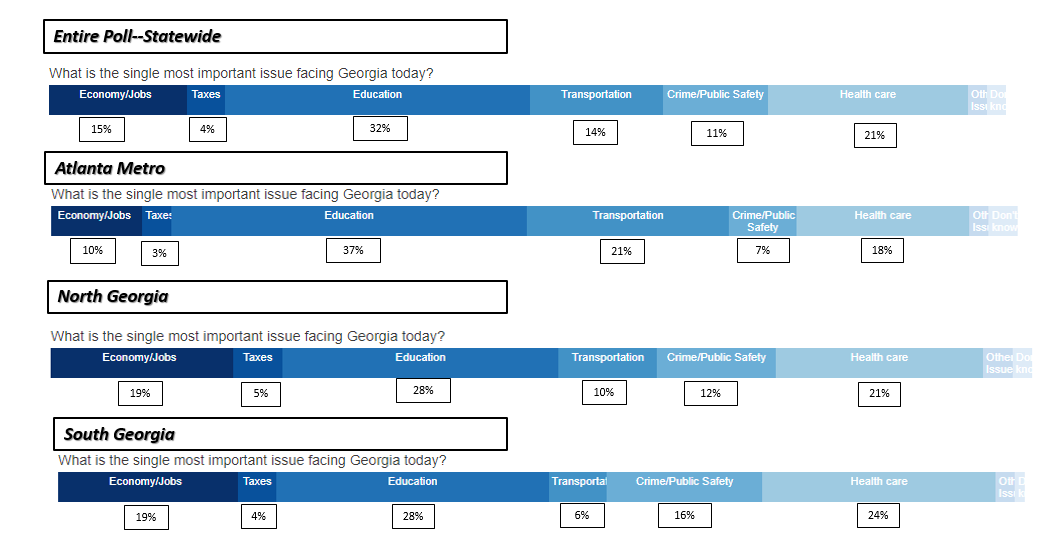
Polls have certainly gotten a great deal of attention lately, for better or worse! Despite some of their shortcomings, polls can tell us some very interesting things, particularly when we are able to see enough difference in answers to eliminate the poll's necessary margin of error as a major concern for interpreting results. Things [...]
Friday Factday: The Atlanta MSA’s Foreign Born Population:
by Global Region and Country of Origin
People born outside of the United States comprised an estimated 13.7% of the 29-county Atlanta Metropolitan Statistical Area (MSA)'s population in 2016 and accounted for an estimated 5.1% of the region's population growth between 2015 and 2016. In appreciation of the increasing and integral part that the foreign-born play in the regional community and [...]
Regional Snapshot: State of the Economy
This month's Regional Snapshot provides, at the start of 2018, an overview of the most relevant trends in our metro economy- topics include job growth by sector, changes in wage levels, and trends in residential and commercial (by type) permit and construction activity. Highlights from this snapshot: Metro Atlanta continues to be a national [...]
Monday Mapday: Foreign Born Non-Citizens Decline Statewide
The foreign born population in Georgia grew by an estimated 65,474 people between 2011 and 2016. At this same time, the number of foreign born naturalized citizens declined by 9,935. The foreign born population accounted for an estimated 10% of the state's total population in 2016 and 14% of its growth from 2011 to [...]
Friday Factday: Declines in Mortgage Delinquency–
Masking Lingering Effects of Recession
When it comes to the economy, most of us would likely agree that, while things are better, we "got a ways to go yet". A recent article in the AJC examines the lingering impacts of the Great Recession, pointing out that despite improvements in employment (and even, finally, wages), many are still suffering. One [...]
Friday Factday: A Toy (Spending) Story
The holiday season is upon us! It is a time for festivities and gift giving among friends and family--which means an increase in household spending. According to polling by Gallup, average holiday spending per person nationally is projected to be $906 in 2017, up from $785 in 2016 (see chart below). The most recent [...]
Monday Mapday: Growth in Hispanic Population: 20-County Metro Region
The recent release of 2012-16 American Community Survey (ACS) data gives us an updated ability to look at small-area changes in race/ ethnicity across the metro region. The map below shows the change in share (in percentage points) of Hispanic and/or Latino population by census tract between 2010 and the 5-year period ending in 2016. [...]
Friday Factday: National and Regional Educational Levels–
Attaining, but Barely Gaining (on the “Asks” of the Job Market)
Adults are far better educated "now" than they were in previous generations--higher and higher shares are going to, and completing, college. And this level of education is crucial, as recent Burning Glass data indicate that employers are asking for bachelors degrees or more as qualifications to fill nearly two-thirds of 2017 job postings! A [...]