
Monday Mapday
Maps showing themes and trends, published on Mondays

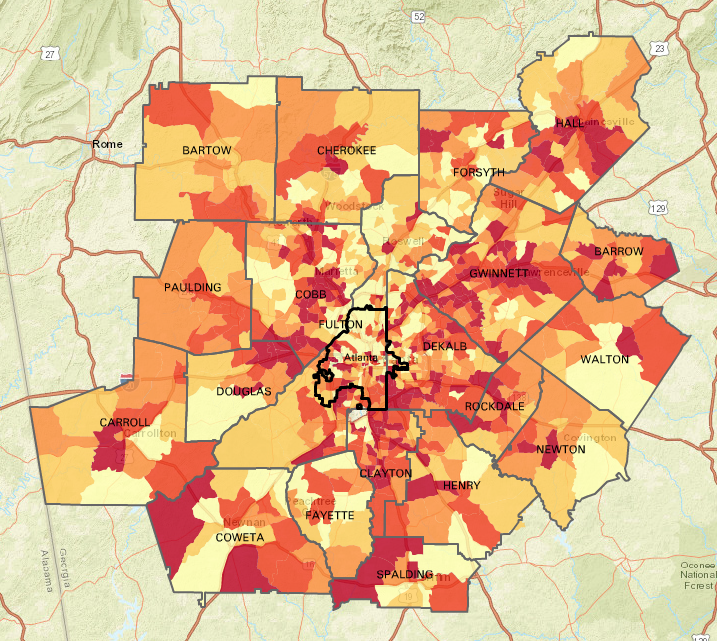
Monday Mapday: 2015 Small Business Loans
As part of the Community Reinvestment Act, data is collected from banks and other lending institutions of a certain size to track where their loans are going (loans reported are for less than $1 million). When [...]

Monday Mapday: Oldest and Youngest Neighborhoods
Using median age from the 2010 U.S. Census, this map shows the "youngest" neighborhoods in purple (median age ranging from 16.1 to 31.3) and the "oldest" neighborhoods in blue (a median age ranging from 39.6 [...]

Monday Mapday: Senior Population
This map shows the neighborhoods in metro Atlanta that have the highest densities of senior residents (age 65+). In these neighborhoods, at least 25% of households have an individual age 65 or older. These areas [...]
Monday Mapday: Kids Without Health Insurance
In metro Atlanta, 9.1% of people under 18 do not have health insurance (an average from 2010-2014 for the MSA, using U.S. Census Bureau American Community Survey data via Neighborhood Nexus). This map shows the [...]

Monday Mapday: Early Voting Turnout
Election Day is tomorrow and 46% of registered active voters in the 20-county metro Atlanta region have already voted. This map shows the percentage of registered active voters who early voted in each county. Forsyth [...]

Monday Mapday: Income by Senate Districts
With Election Day quickly approaching, let's take a look at our Georgia Senate Districts. This map shows median household income by Senate Districts in metro Atlanta counties. This map is similar to other income-based maps, [...]