
Monday Mapday
Maps showing themes and trends, published on Mondays

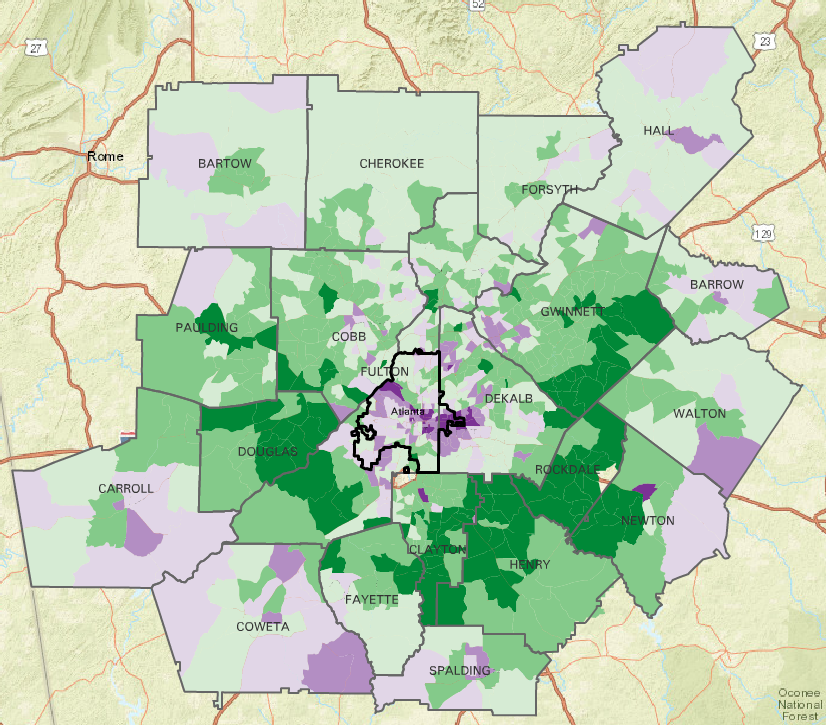
Monday Mapday: Female-Headed Households in the Metro Region
March is Women's History Month. At 33n, we will be making women the focus of many of our posts this month -- in recognition of all the women who have shaped our history, are [...]

Monday Mapday: Living Alone on Valentine’s Day
Valentine's Day is just around the corner, and while it would be nice to be able to share with you a definitive map of where love is and is not in the metro region, [...]
Monday Mapday: Shifting Racial Demography in Metro Region
The maps below visually confirm what many already know to be the case: racial demography in the Atlanta Metro region has shifted considerably since 2000. In particular, the City of Atlanta, which began to [...]

Monday Mapday: Exploring Changes in Home Ownership
As examined in a previous post on this blog, one aftereffect of the recession was decline in home ownership due to foreclosures and more stringent loan requirements. According to a recent report by the [...]


Monday Mapday: Declining Share of 65 Plus Population
In (Most) Core Urban Areas in Region
The Atlanta Metro region as a whole experienced widespread growth in the proportion of residents that is 65 years and over between 2000 and the most recent American Community Survey (ACS) 5-year estimates (2012-16). The [...]

Monday Mapday: Foreign Born Non-Citizens Decline Statewide
The foreign born population in Georgia grew by an estimated 65,474 people between 2011 and 2016. At this same time, the number of foreign born naturalized citizens declined by 9,935. The foreign born population [...]