In previous blog posts, we have explored the growth of work from home (WFH) in the Atlanta region. [1] First, we saw a slow, steady rise over the 2010s. A large spike due to pandemic onset followed. Finally, there was a small decline in 2022 to what may well be the “new normal” for WFH.
How does Atlanta compare to other metros? To address this question, we return to data from the American Community Survey (ACS), specifically the 1-year estimates for metropolitan core-based statistical areas.[2]
Figure 1 shows the change over time (2010-22) in the percent working from home for the twenty most populous CBSAs.[3] It shows that the general pattern observed for Atlanta is almost universal. The lone exception is found in Tampa, where WFH share held steady between 2021 and 2022 rather than declining.
Figure 1: Trends in Shares Working From Home, Twenty Largest Metros, 2010-2022 (Source: ACS)
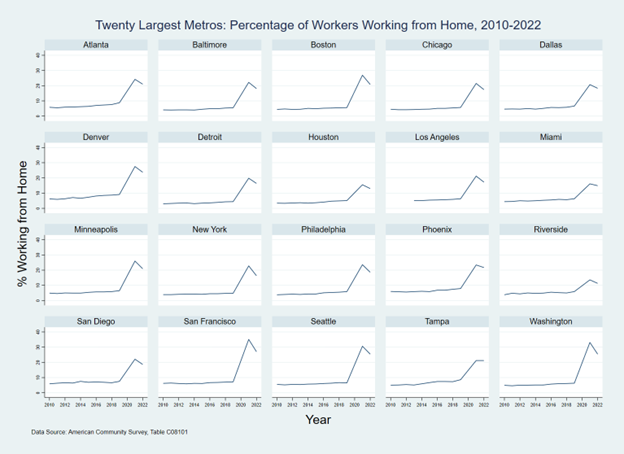
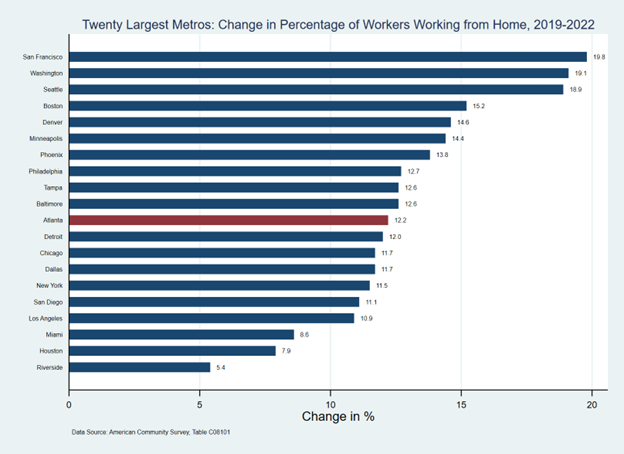
Figure 2 below focuses on the change in percent WFH between 2019 and 2022 for these same twenty metro areas. We see that Atlanta is in the middle of the pack, ranked #11 of 20, with an increase of 12.2 percentage points in WFH share from 2019 to 2022.
Figure 2: Percentage Point Change in Shares WFH, Twenty Largest Metros, 2019-2022 (Source: ACS)
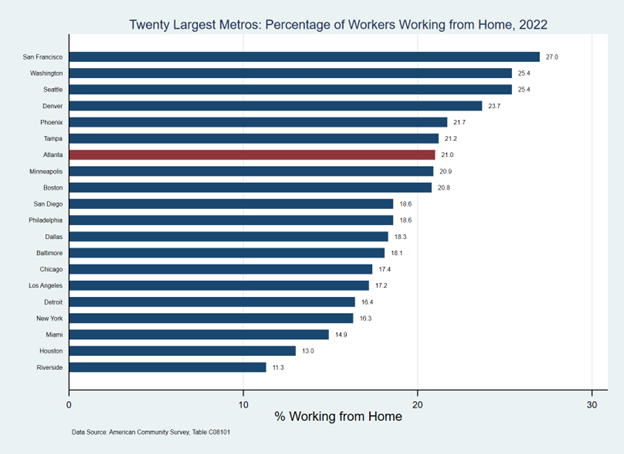
The limited “growth” in share for Atlanta is due in part to the fact that Atlanta started at a higher percentage of WFH than many of its peers. Figure 3 that follows shows that, at 21%, Atlanta is ranked #7 among the twenty largest metros, as of 2022, in terms of working from home…as opposed to 11th in change 2019 to 2022.
Figure 3: Shares Working from Home, Twenty Largest Metros, 2022 (Source: ACS)
What accounts for the variation between metro areas in terms of WFH? Let’s consider two indicators: one that measures motive, and the other opportunity.
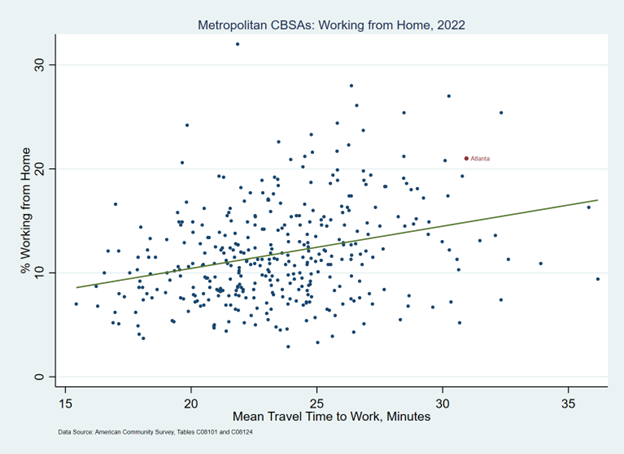
The pain of commuting can provide a powerful motive for working from home. Figure 4 below shows the relationship between the mean travel time for commuters and the percent working from home for all metropolitan CBSAs nationwide. The trend line has a slope of .41.[4] With a mean travel time to work of 30.9 minutes and 21% WFH rate, Atlanta falls somewhat above the trend line. However, this relationship is not particularly strong, in that the points in this scatterplot do not hew closely to that prediction line (r=.29).
Figure 4: Metro Shares Working from Home Compared to Mean Travel Time, 2022 (Source: ACS)
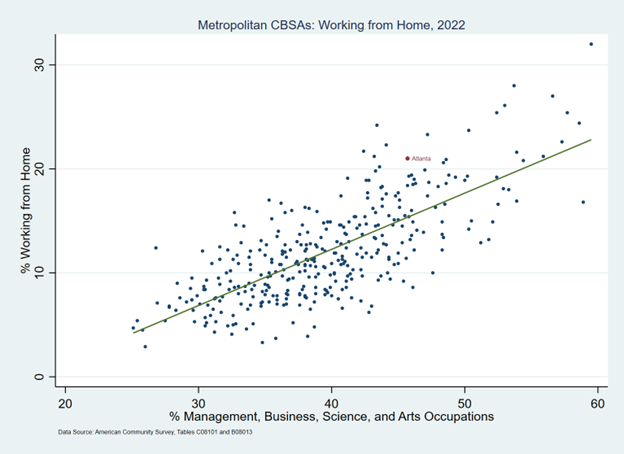
But we must recognize that not all jobs are equal in their opportunity for WFH, as some jobs must be performed in person. Figure 5 shows the relationship between the percent of workers in management, business, science, and arts occupations (arguably the most white-collar, or “office-using” among the occupation categories) and percent WFH.[6] The dots in this plot cluster tighter to the trend line than the previous graph, indicating a much stronger relationship (r=.74) Again, the trend line is positive, with a slope of .54.[5] The Atlanta CBSA again lies a bit above the prediction line, with 45.7% of its workers in these white-collar occupations, and 21% WFH.
Figure 5: Metro Shares Working from Home Compared to Shares of “Office-Using” Occupations, 2022 (Source: ACS)
So, while Atlanta exhibits a WFH rate a bit higher than we might expect based on these two criteria, it is not a crazy outlier either.[7]
Footnotes:
[1]https://33n.atlantaregional.com/data-diversions/did-we-return-to-the-office-in-2022 and https://33n.atlantaregional.com/data-diversions/whos-working-from-home
[2] Core-based statistical areas (CBSAs) are delineated by the Office of Management and Budget. They consist of groups of counties with a “high degree of economic and social integration” (think commuting patterns) with one or more core urban areas. The most recent iteration of Atlanta’s CBSA, as of July 2023, is officially called the “Atlanta-Sandy Springs-Roswell, GA” Metropolitan Statistical Area and recognizes six principal core cities: Alpharetta, Atlanta, Dunwoody, Marietta, Roswell, and Sandy Springs. CBSAs come in two flavors: metropolitan CBSAs have at least one core city with population over 50,000, while micropolitan CBSAs have at least one core city of population at least 10,000, but none reaching 50,000 population. There are currently 393 metropolitan CBSAs and 542 micropolitan CBSAs in the United States. For more information about CBSAs, see https://www.census.gov/programs-surveys/metro-micro/about.html.
[3] We’re #6! In terms of population, per the Census Bureau’s most recent (2023 Vintage) estimates, that is.
[4] This means that that for each extra minute of travel time that commuters face, we can expect to see on average an additional 0.41 percentage point of work from home (WFH) share.
[5] Thus, for each additional percent of workers in these white-collar occupations, we would expect to see 0.54 percent additional WFH overall.
[6] ACS table C08124 reports means of transportation to work for six occupation categories: management, business, science, and arts occupations; service occupations; sales and office occupations; natural resources, construction, and maintenance occupations; production, transportation, and material moving occupations; and military specific occupations.
[7] That outlier in the far northeast corner of Figure 5? Boulder, Colorado.

