In a recent blog post, we identified and examined “banking deserts” in the Atlanta region. As we noted then, different ways of describing access issues might identify different problem areas. Let’s dig a little deeper into this issue.
Existing definitions of banking deserts all involve drawing a circle of some radius around each bank and analyzing what falls within the circle. These definitions mostly differ on the size of the radius used and whether to use circles of different radii depending on the type of community. But since you typically can’t travel in a straight line, this kind of model may cause us to miss some areas with poor access to a bank.
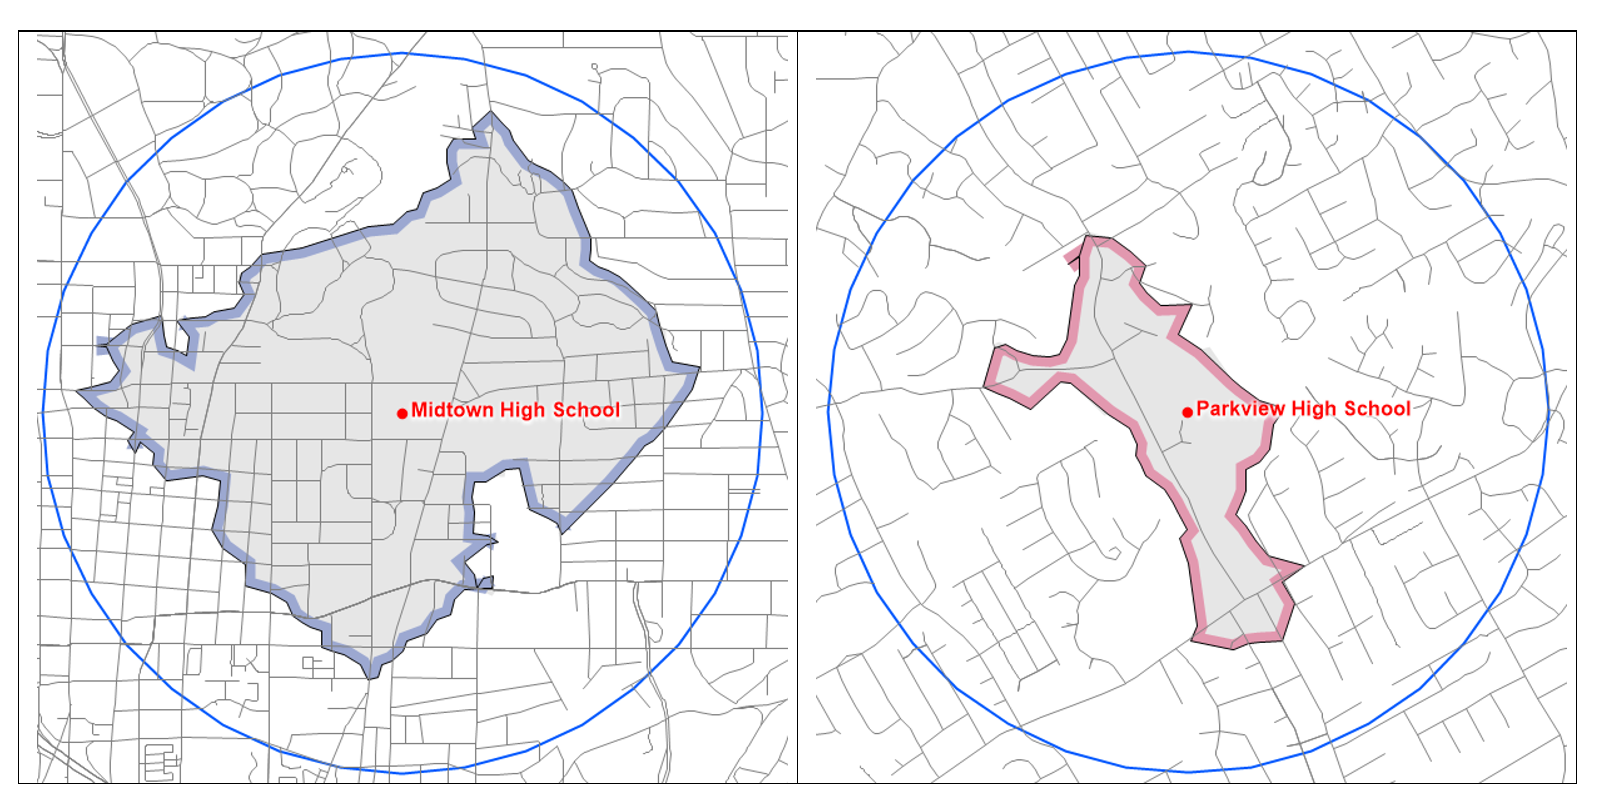
We’ll need to remember a little high school geometry to investigate this point. So as a quick tangent, let’s consider access issues (see Figure 1 below) for two area high schools– a factor that comes into play when determining whether students can be expected to walk to school or if bus service will be required. The blue circle represents a one-mile radius around each school’s location.
Figure 1: Midtown and Parkview High Schools: One-Mile Radii (Source: ARC RAD)

From geometry class, you’ll recall that the formula for area of a circle is A = πr², so the area of a 1-mile radius circle around each of the schools is about 3.14 square miles. But that assumes that you can travel in a straight line. If you restrict your movement to where the roads will actually take you, a mile’s travel around Midtown high school is the smaller shaded area of about 1.31 square miles, or about 42% of the circle. That’s in central Atlanta, where the road network is fairly compact; residential lots are bigger and the road network is more spread out in suburban areas. One mile’s travel over the roads around Parkview High School in Gwinnett County comes in at only about 11% of the 1-mile circle, or 0.36 square miles.
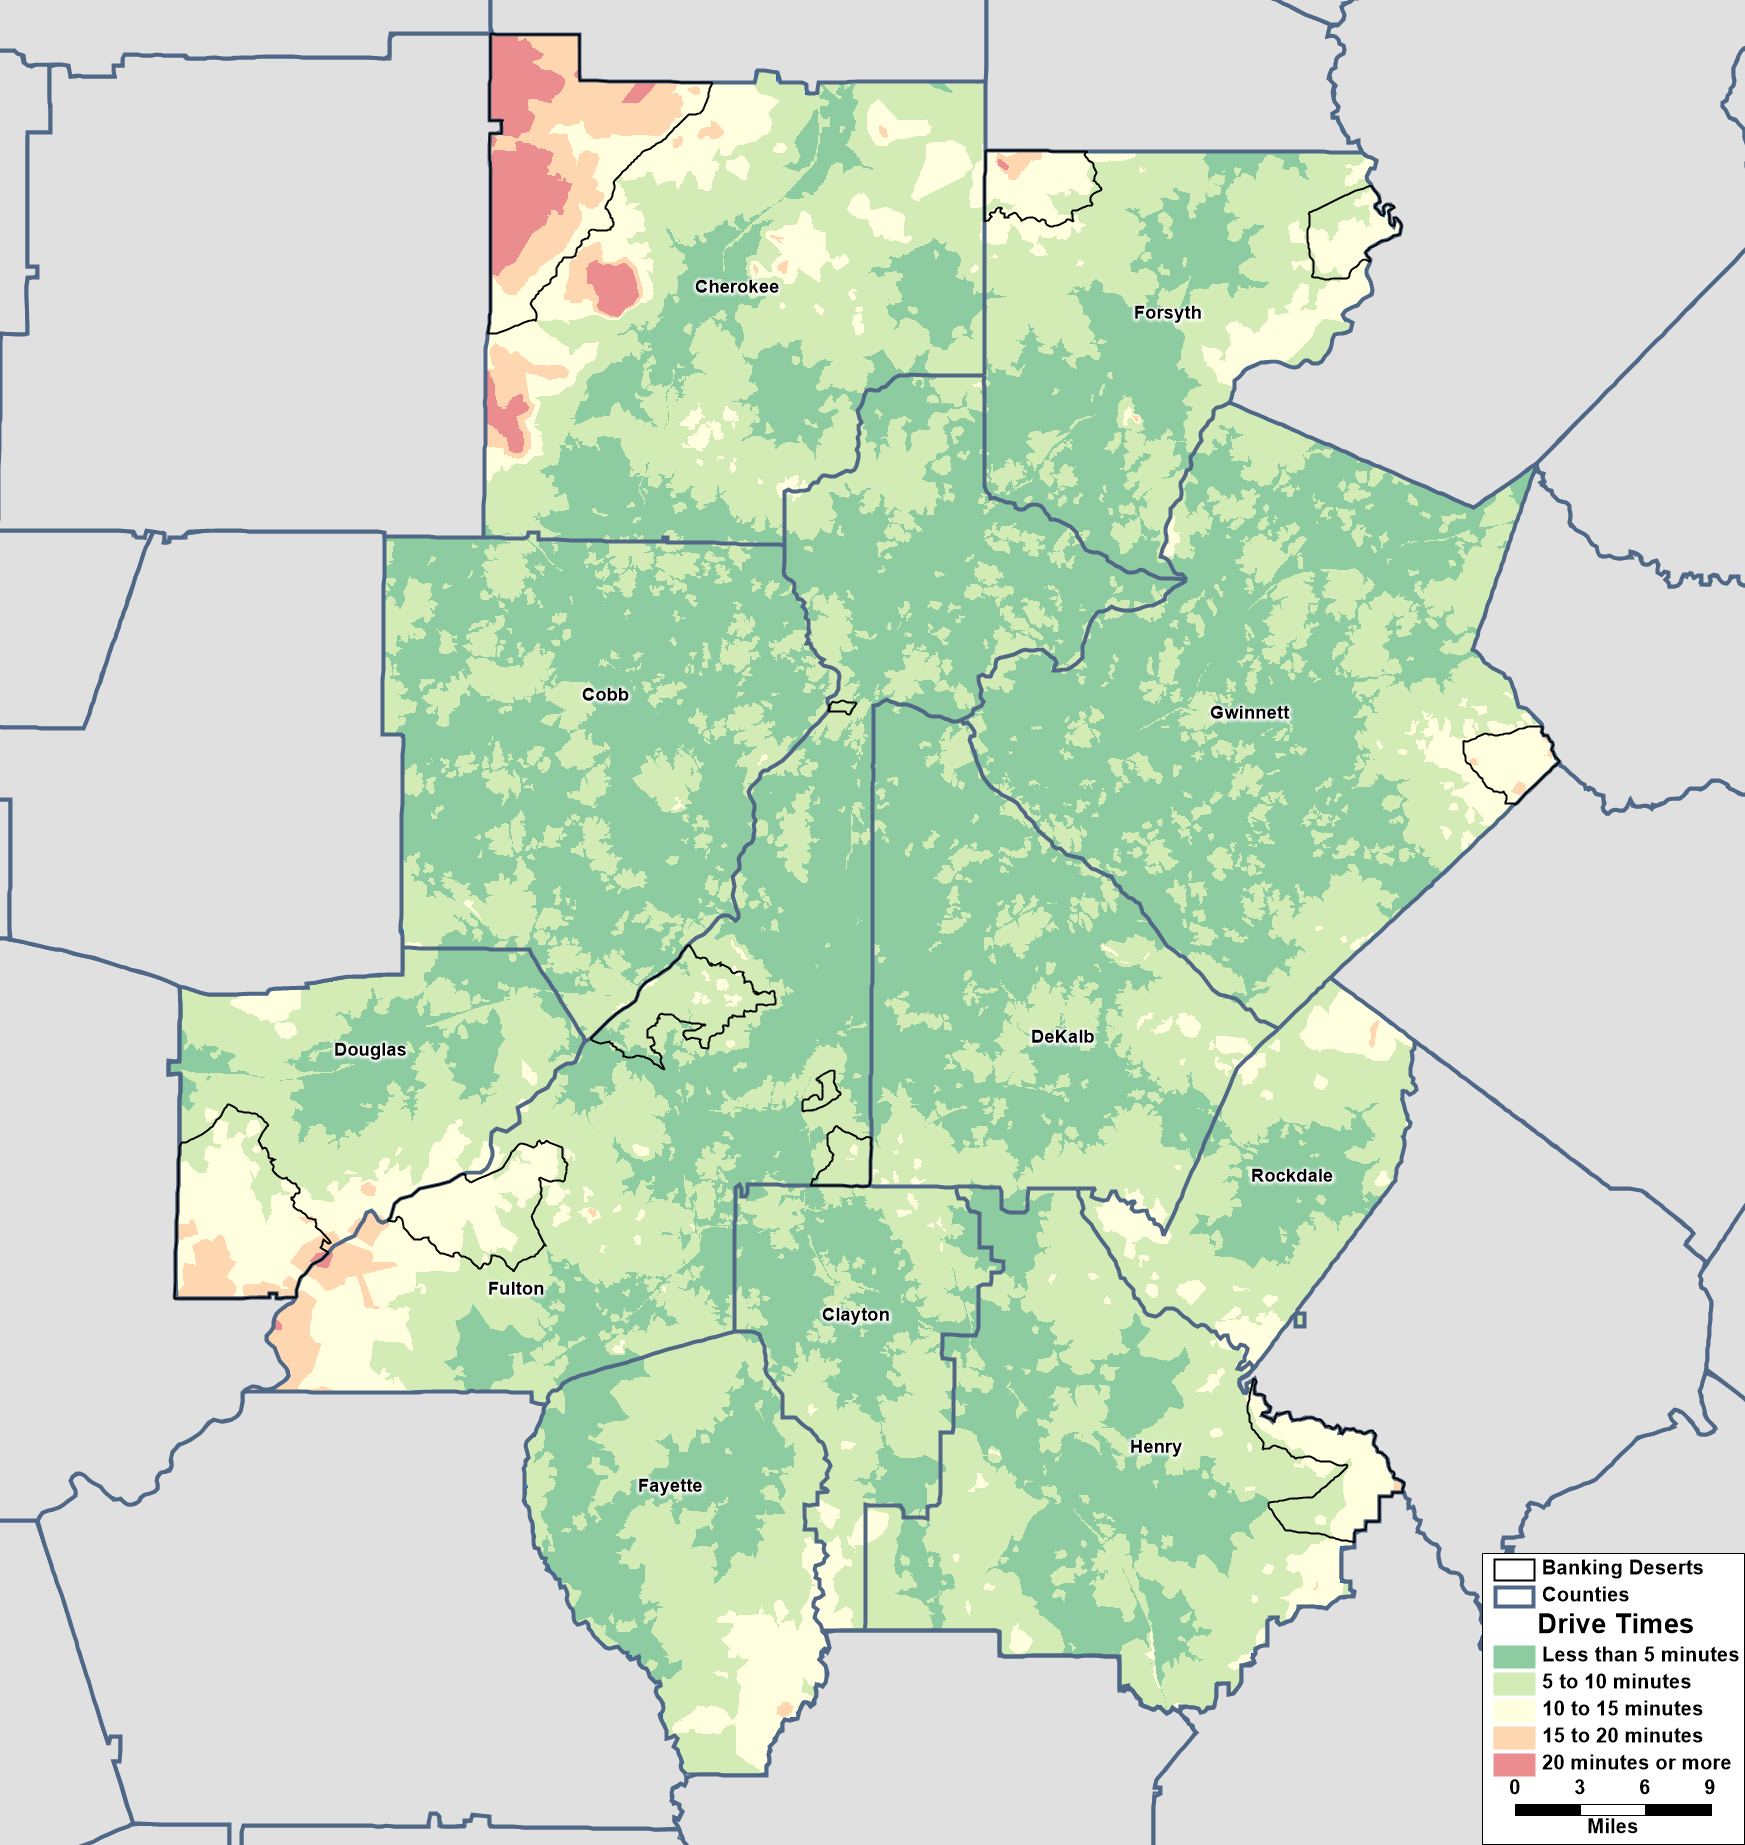
As an alternative to straight-line distances, we might look at drive times for travel. Figure 2 below shows travel times estimated for normal (i.e., non-rush hour) traffic using Caliper’s Maptitude mapping software calculated over the HERE streets network [1]. Areas identified as banking deserts using the Philadelphia Fed’s method [2] are overlaid for reference:
Figure 2: Drive Times (Source: ARC RAD, HERE network, Philadelphia Federal Reserve Bank)

We see in Figure 2 above that, with the possible exception of the desert in southwest Atlanta, all of the areas identified as banking deserts have longer and average drive times to reach a bank. But there are other areas with especially long drive times that are overlooked by the Philadelphia Fed’s method, Examples include the area of Cherokee County just south of the identified desert and also the southwestern tip of Fulton County on the border with Douglas County. These areas may not qualify as banking deserts under the Philadelphia Fed definition, but they definitely suffer from a banking drought.
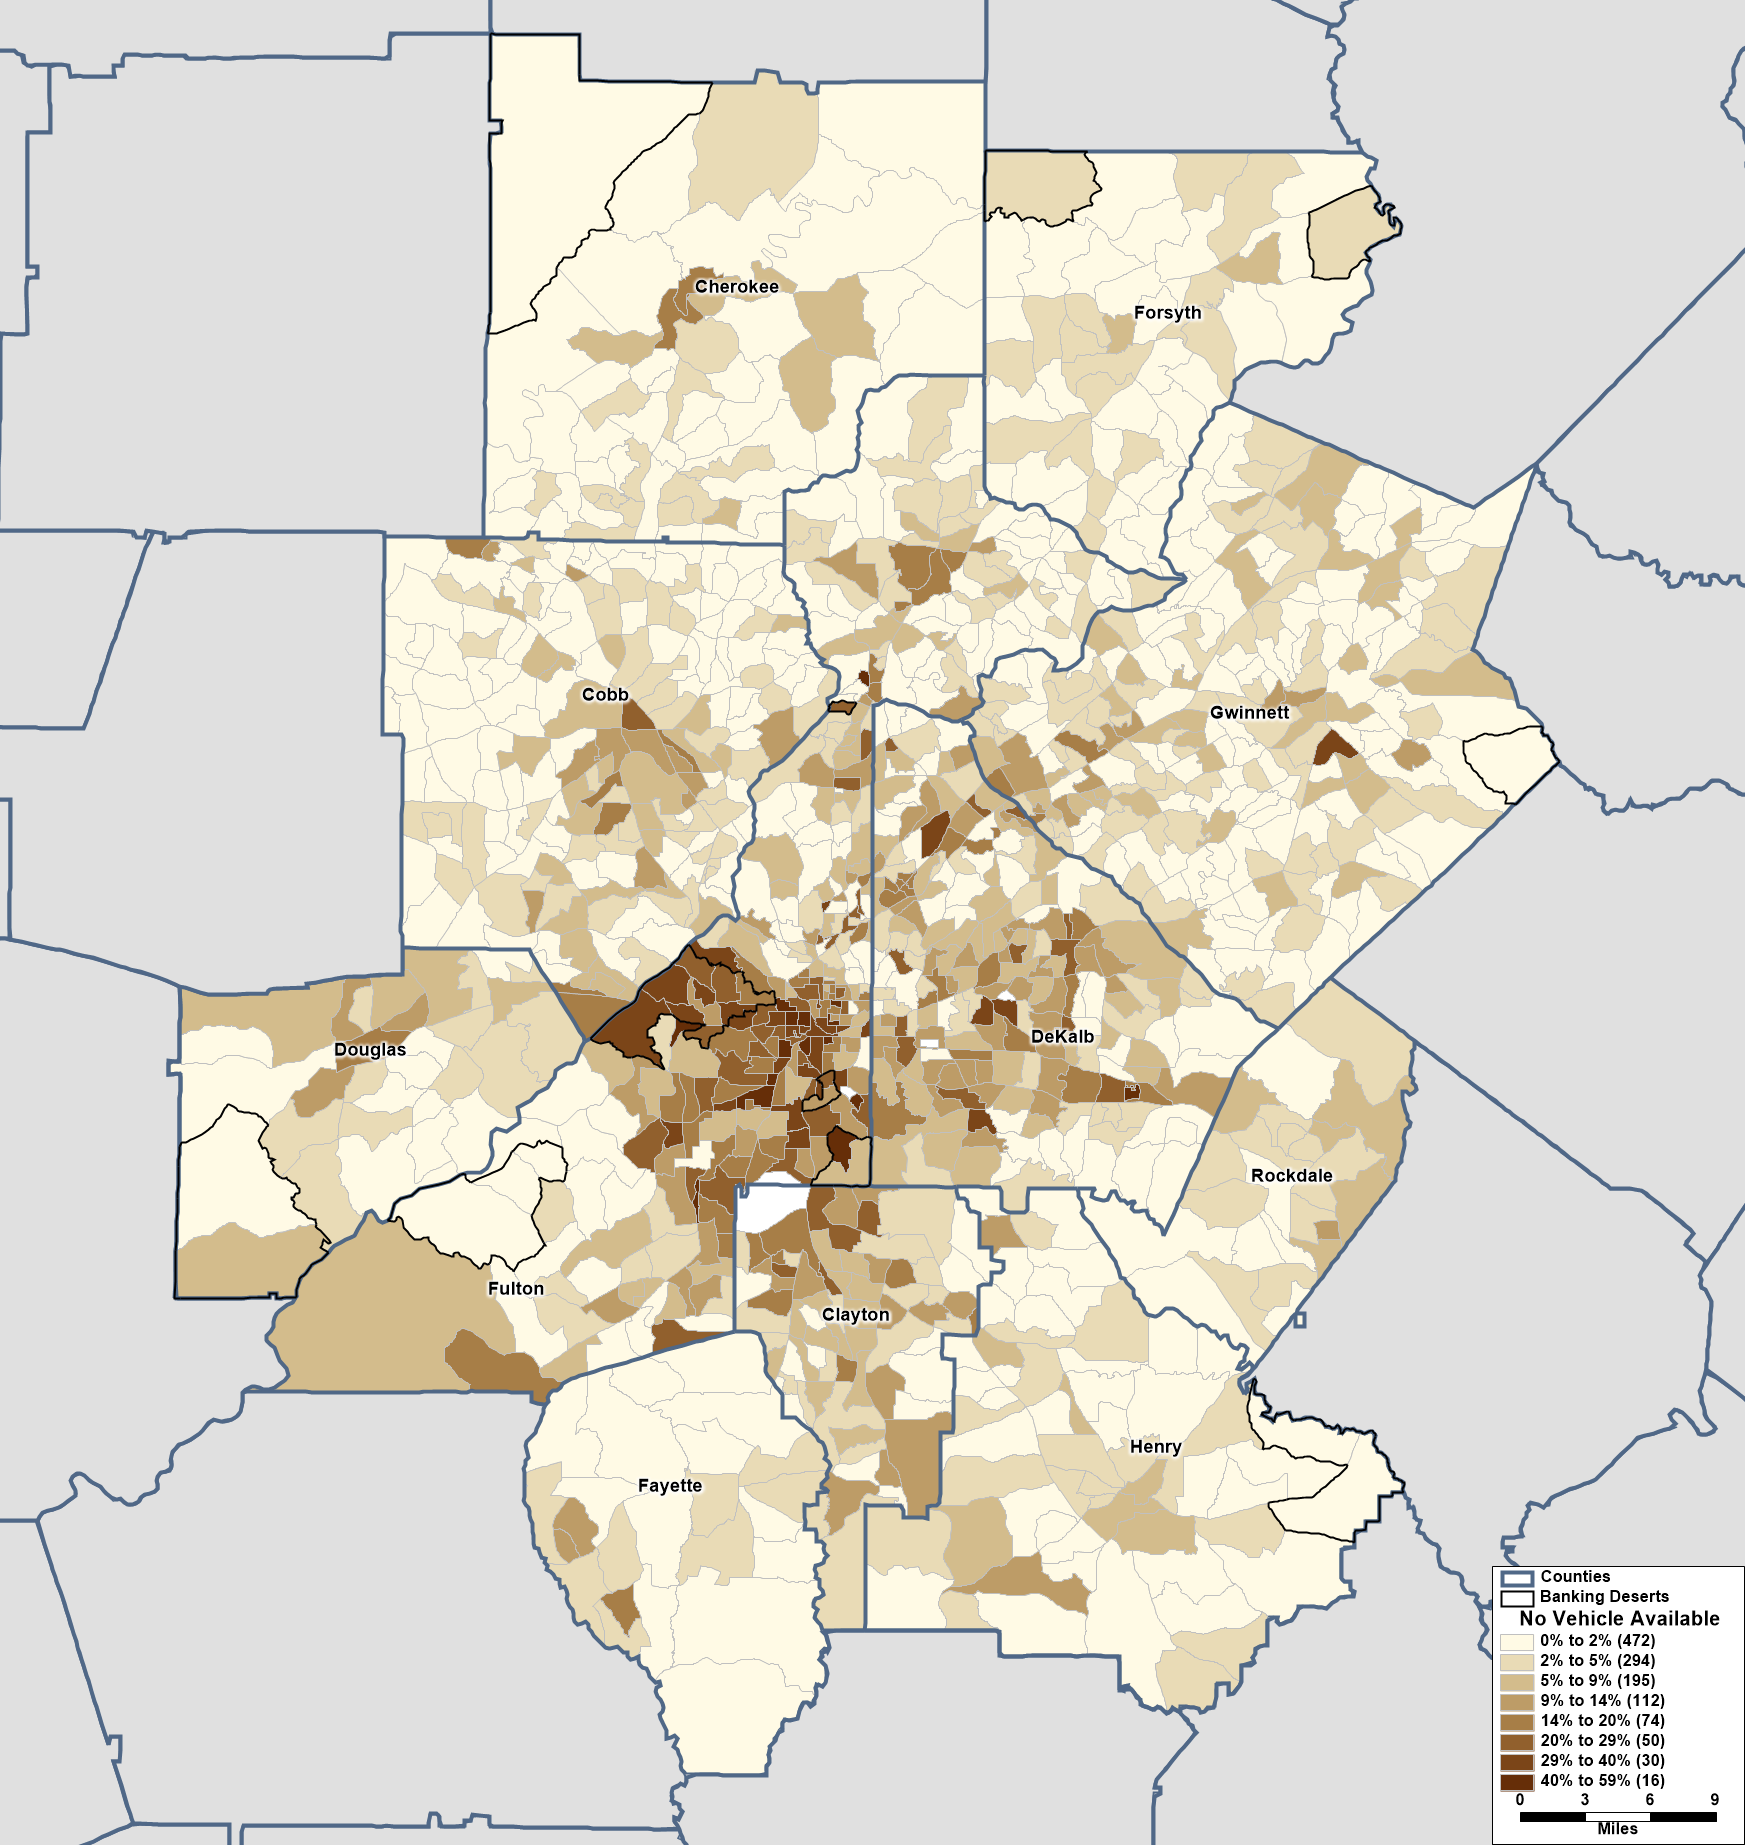
Of course, drive times are only relevant if you have access to a vehicle. Figure 3 below shows the percentage of households with no vehicle available by Census tract, according to the latest (2017-2021) American Community Survey 5-year release [3]. Again, the banking deserts identified according to the Philadelphia Fed’s method are included for reference, and we see that Southwest Atlanta’s large banking desert coincides with a part of our region with low rates of access to a vehicle.
Figure 3: Lack of Vehicles by Census Tract and Banking Deserts (Source: ACS 5-year (2017-2021) and ARC RAD)

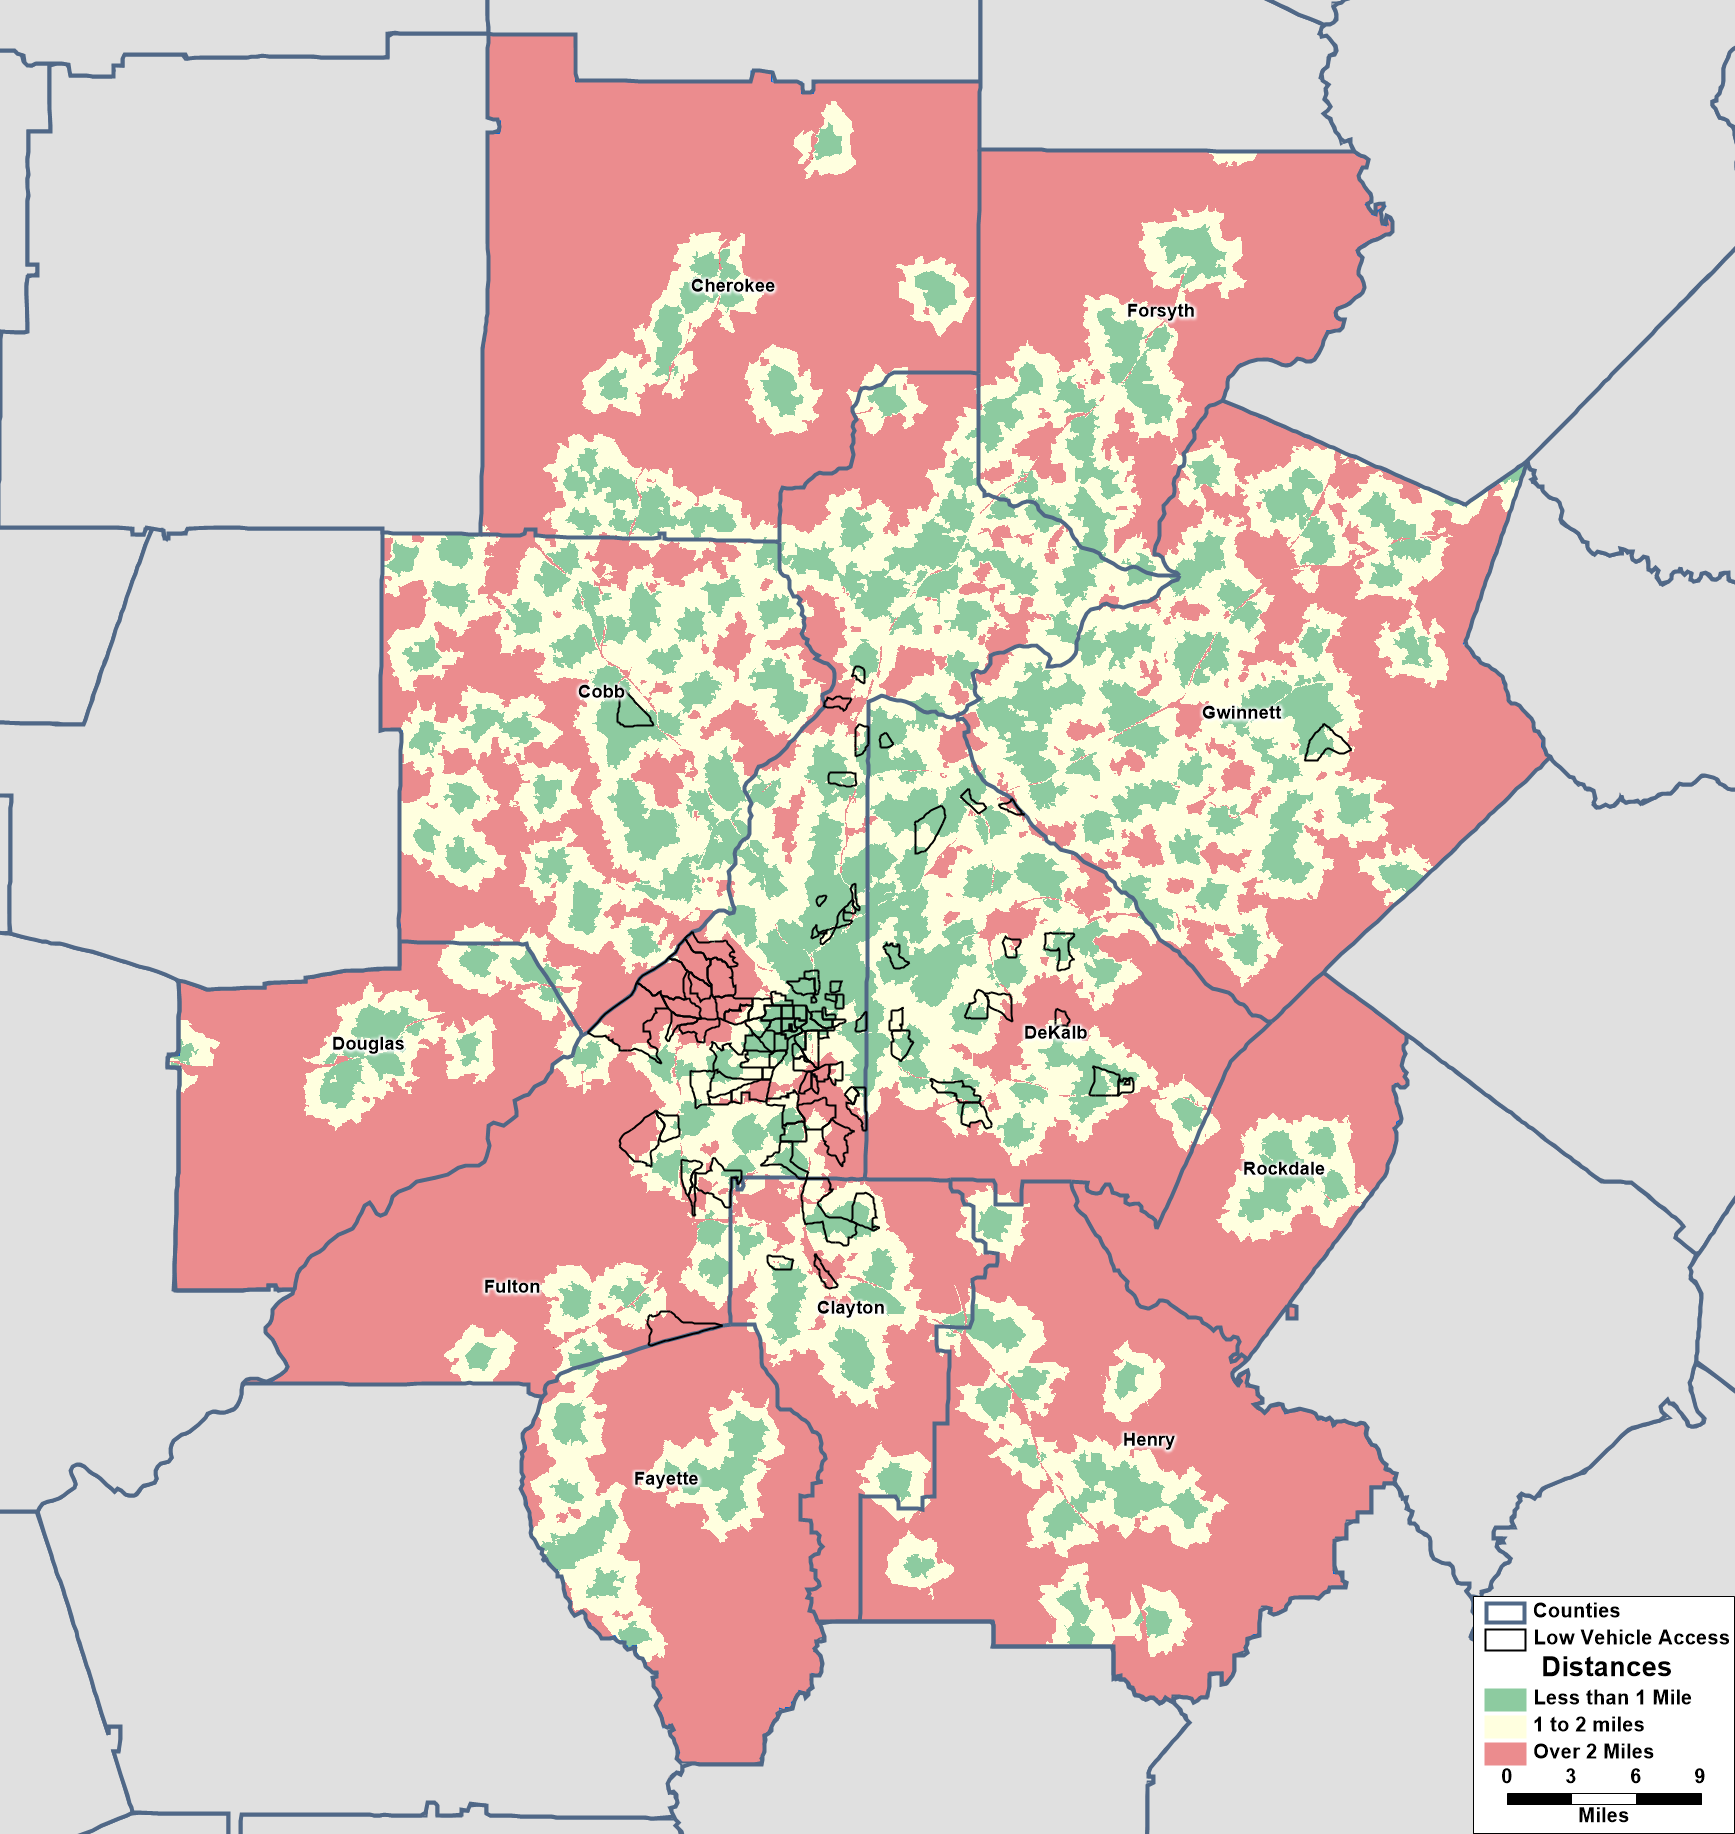
Distance, rather than drive time, is more relevant for areas with low rates of vehicle access. This map presents travel distances to the nearest bank with an eye toward walkability. Census tracts where 20% or more of households lack access to a vehicle are overlaid for reference. We can see that the Southwest Atlanta banking desert indeed has poor access when you look at a combination of distance and vehicle access: a significant percentage will have to walk or take transit to the bank for a distance of over two miles.
Figure 4: Travel Distances by Road (Source: ARC RAD, HERE Network, ACS 2017-2021)

Footnotes:
[1] For more information about drive time zones and the tool within Maptitude mapping software, see https://www.caliper.com/maptitude/solutions/drive-time-zones-map.htm.
[2] See the previous blog post
[3] These data can be found in ACS Table B08201.To help identify outliers, the categories shown in this map represent Jenks’ “natural breaks.” The numbers inside parentheses within the map legend reflect the number of tracts falling into each category.

