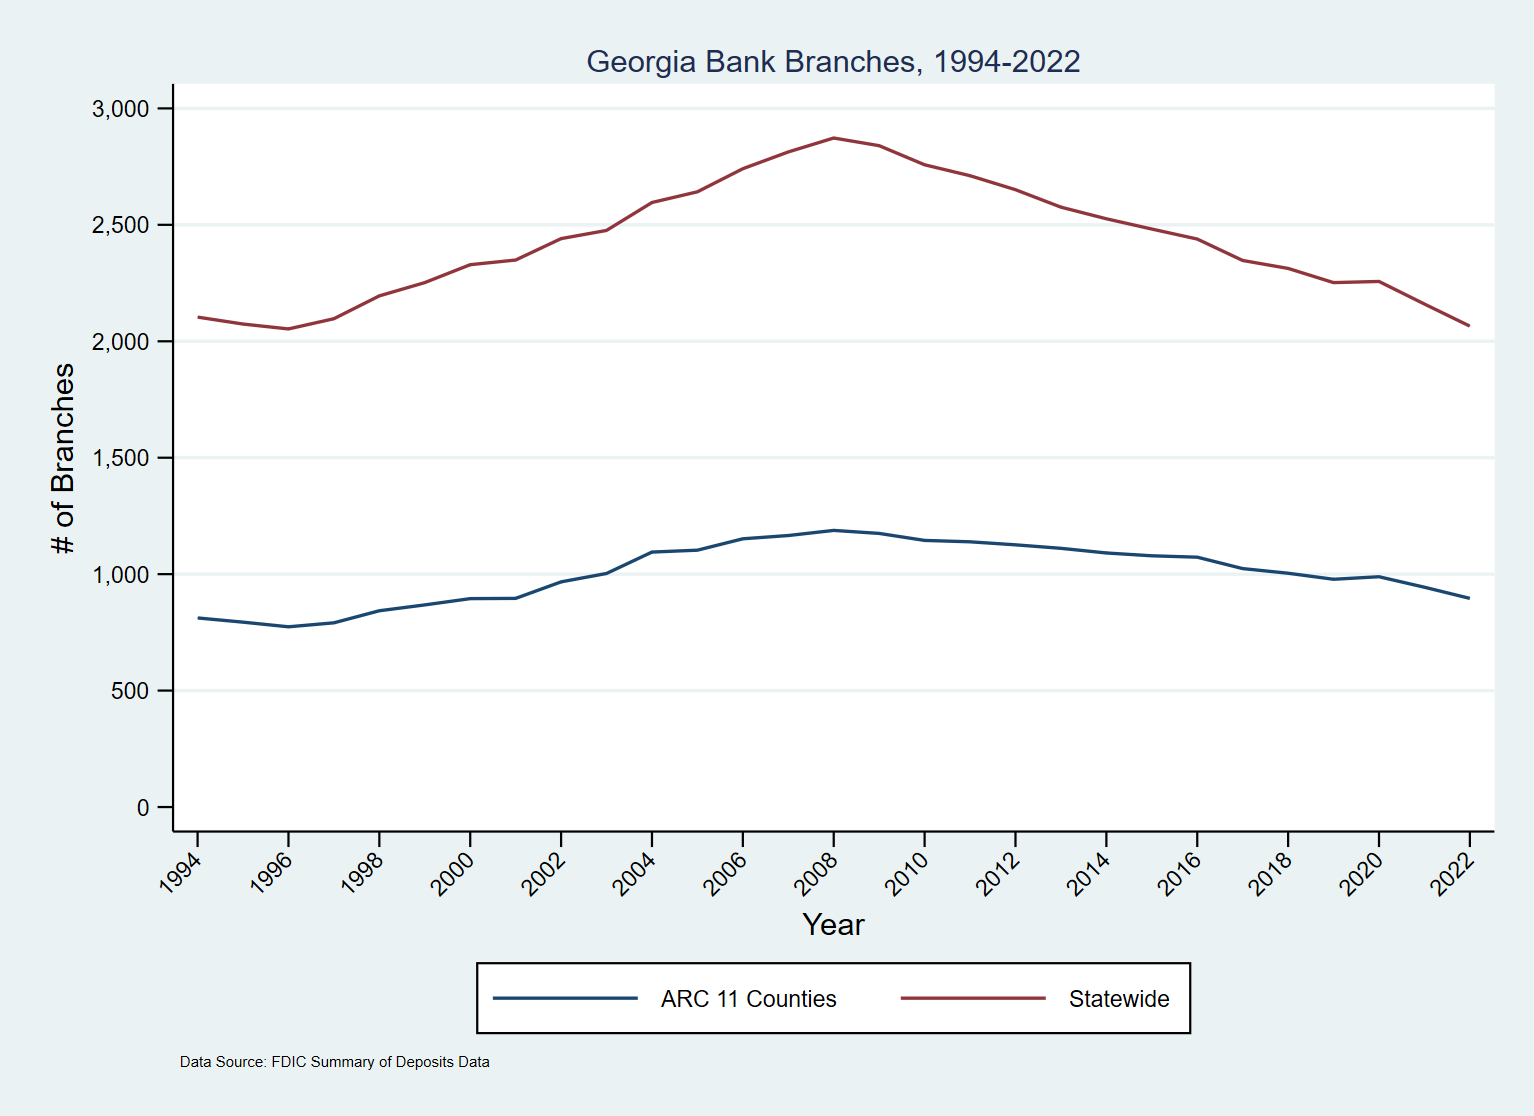
The number of bank branches both in Georgia and the Atlanta region saw steady growth starting in the 1990s and continuing for much of the 2000s. Locations peaked just before the start of the Great Recession, but the number has been on the decline ever since, as shown in Figure 1 below.
Figure 1: Annual Trends in Georgia Bank Branches: 1994-2022 (Source: FDIC, ARC RAD)

The number of bank branches in the region has dropped 25% since 2008, during a period when the population has grown about 21%. Some might attribute this reduction in the number of bank branches to bank mergers. Others might argue that there is simply less demand for in-person service, given the ever-growing capabilities of online banking—and the increase in online usage driven by the pandemic.[1] Whatever the reason, however, there remain instances when a visit to the bank is necessary: you may have received a check (or set of checks) too large to qualify for mobile deposit; you may own a business needing to make cash deposits (or receive certain denominations of bills or coins to make change); or you may need to get a certified check for a large purchase (such as a home).
What areas have lost banks? And what does access to in-branch banking look like in the current environment?
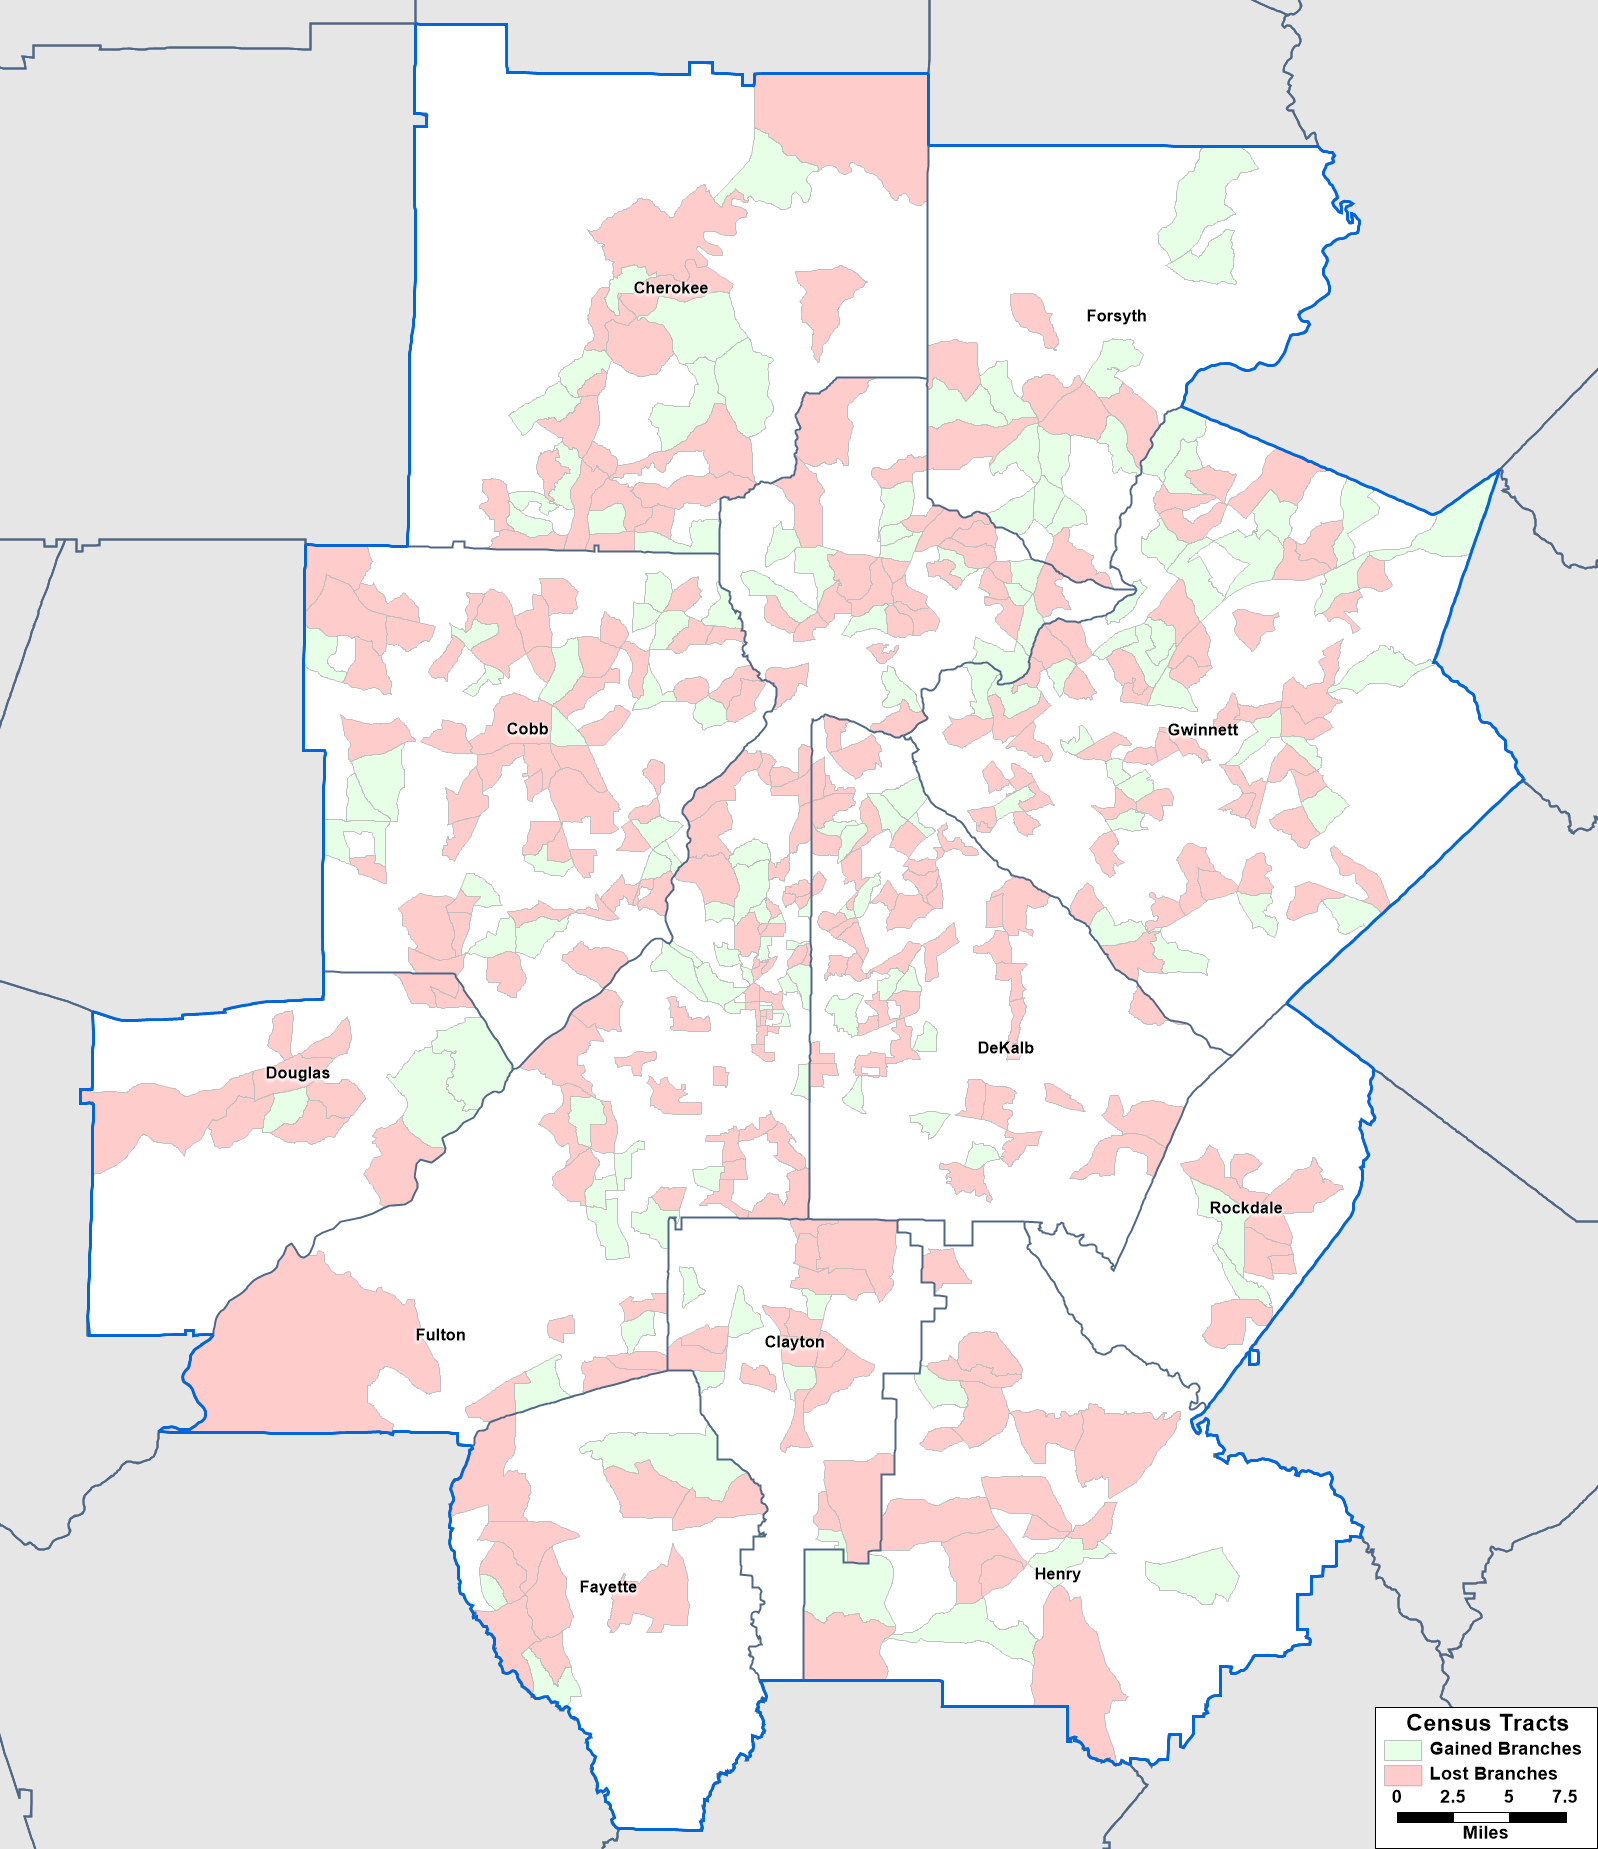
For answers to these questions, we turn to the Federal Deposit Insurance Corporation (FDIC) Summary of Deposits (SOD) dataset. This is a survey that all FDIC-insured banks are required to fill out annually, including the location of all branches and the deposits held as of June 30 of each year. Though we have experienced a net loss of bank branches 2008-2022, many new branches have opened during the period, as well. While 301 Census tracts had fewer bank branches in 2022 than in 2008, 147 tracts had more branches than before the Great Recession midpoint, as shown on Figure 2 below.
Figure 2: Bank Branch Gains and Losses 2008-2022: 11-County Tracts (Source: FDIC, ARC RAD)

Other than the fact that the tracts with losses outnumber the ones with gains by a margin of two-to-one, the main pattern appears to be one of retrenchment rather than any systematic spatial shift. The only other clear pattern was that tracts with large percentage gains in population were more likely to show an increase in number of branches.[2]
What does bank access look like, then? One possible lens we might use is the concept of a “banking desert”– an area meeting some size threshold lacking access to a bank. There is no one universally accepted threshold, so for the purposes of this blog post, we will use the definition proposed by the Federal Reserve Bank of Philadelphia as Census tracts, “without any bank branches within a fixed-radius distance (two miles in urban areas, five miles in suburban areas, and 10 miles in rural areas) from the population-based centroid of the tract.”[3]
Also under that Philadelphia Fed definition, urban tracts are those for which the majority of the population lives within the “Principal Cities” of a Metropolitan Statistical Area (MSA); in the case of our region, that translates to Alpharetta, Atlanta, Marietta, and Sandy Springs. All other tracts within an MSA would be considered suburban, while tracts outside of any MSA would be classified as rural. Since the ARC 11-county region falls entirely within Atlanta’s MSA, the rural category does not apply.
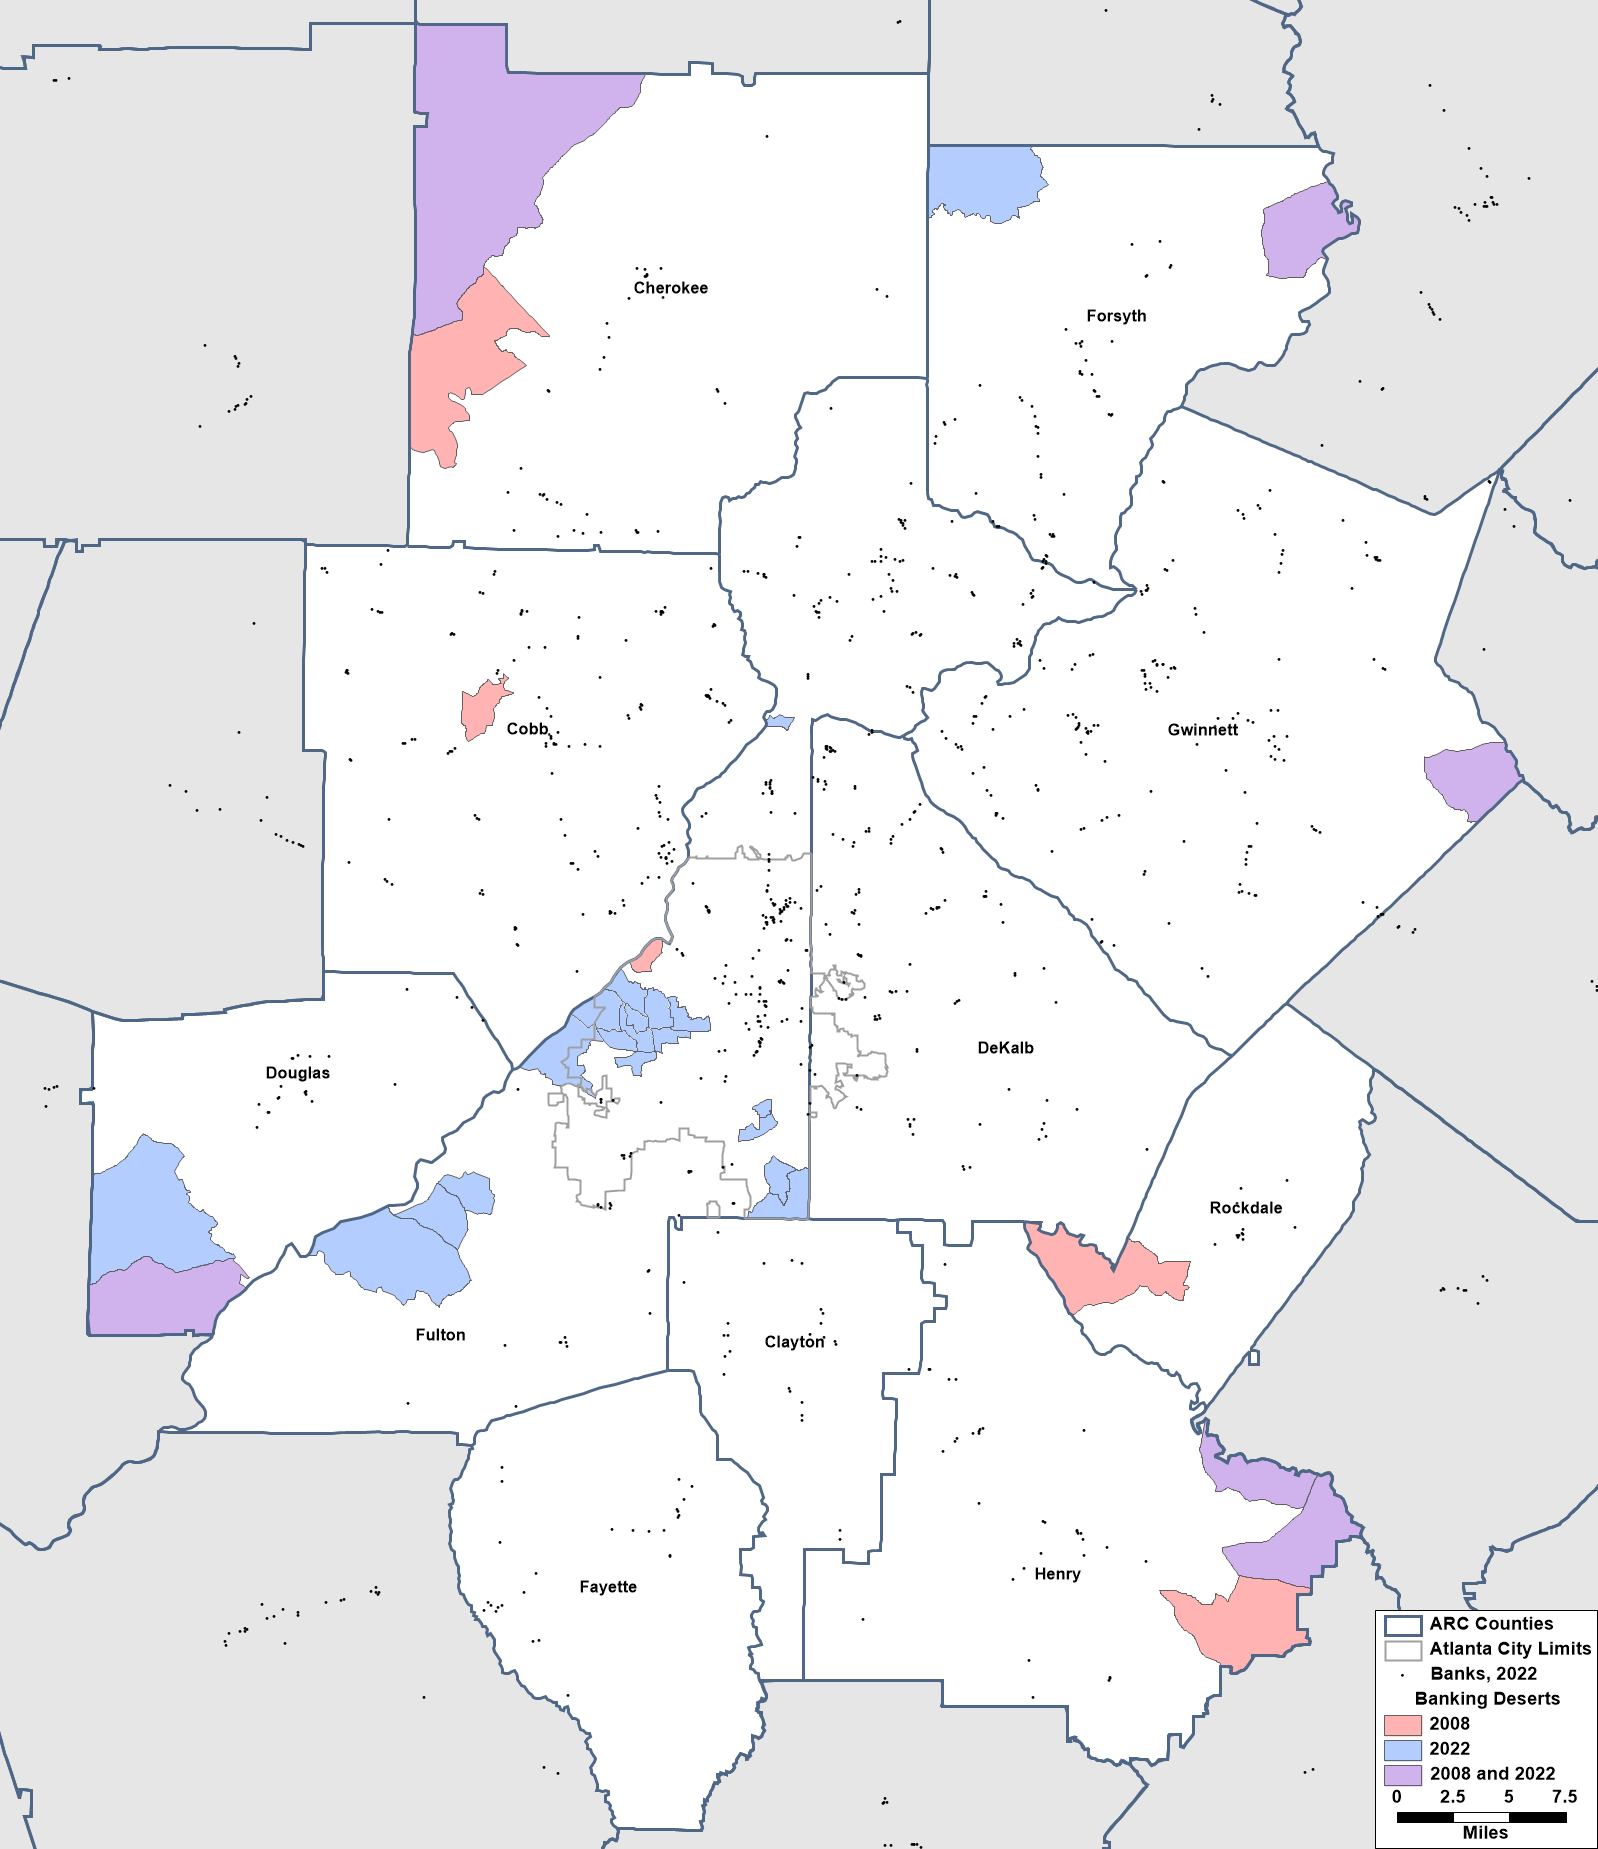
Using this definition, we can identify tracts that were in a banking desert in 2022 and compare with the picture from 2008.[4] As Figure 3 below shows, the number of banking deserts rose from eleven tracts in 2008 to twenty in 2022, of which six tracts were banking deserts in both 2008 and 2022. Bank openings through to 2022 relieved the drought in the remaining five of 2008’s deserts. Eight of the ARC’s eleven counties have at least one banking desert, the exceptions being DeKalb, Clayton, and Fayette. The largest banking desert, both in terms of the number of tracts and the total population residing the area,,is a ten-tract cluster falling primarily inside Southwest Atlanta[5]; most of the remaining deserts are at the periphery of the region, as shown below.
Figure 3: “Bank Desert” Tracts: 2008 and 2022 (Source: FDIC, ARC RAD)

So how many of our residents live these banking deserts and what do the deserts look like, demographically?
Using 2020 Census data, 89,050 people reside within our region’s banking deserts, or about 1.8% of the total population. Non-Hispanic Blacks are most likely to live in a banking desert (2.7%), followed by non-Hispanic Whites (1.7%). Hispanic or Latino populations (0.7%) and Non-Hispanic Asians (0.2%) are the least likely to live in a banking desert.
Not surprisingly, banking deserts are more likely to exist in lower-income areas. According to the latest American Community Survey data (2021), average median household income in the 26 banking desert tracts was $64,510, compared with $86,808 for the average “non-desert” tract. Similarly, the average desert tract had 19.3% of the population below poverty, as compared with an average of 11.5% for “non-desert” tracts.
It’s worth noting that oddly shaped Census tracts, the definition of urban vs. suburban tract, and differences between distances over street networks vs. straight line distances (aka “as the crow flies”) can all have an impact on these findings. In a future follow-up post, we will take another look at bank access through the lens of access via the street network.
Footnotes:
[1] Research from the Federal Deposit Insurance Corporation (FDIC) lends credence to this argument. Despite a reduction in the number of branches, the FDIC National Survey of Unbanked and Underbanked Households found that unbanked households in the Atlanta MSA dropped from 5.0% in 2019 to 2.4% in 2021—a statistically significant improvement. See https://www.fdic.gov/analysis/household-survey/index.html.
[2] Statistical testing found no evidence for an exodus from higher poverty areas or areas with large minority populations. If anything, there was greater churn (both openings and closings) in predominantly non-Hispanic White areas.
[3] See https://www.philadelphiafed.org/-/media/frbp/assets/community-development/reports/230216-banking-deserts-report.pdf for more discussion of how the researchers measured banking deserts. For other takes on this concept, see https://www.stlouisfed.org/en/publications/regional-economist/second-quarter-2017/banking-deserts-become-a-concern-as-branches-dry-up and https://libertystreeteconomics.newyorkfed.org/2016/03/banking-deserts-branch-closings-and-soft-information/
[4] For the sake of uniformity, we analyze 2020-era Census tracts for both time periods.
[5] These ten tracts have a combined population of 30,319 according to the 2020 Census, accounting for just over 1/3 of the region’s population residing in banking deserts.

