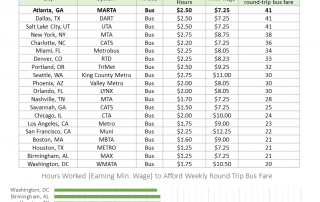
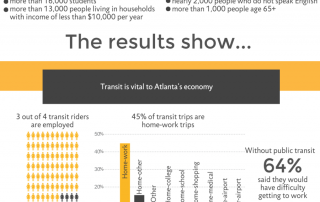
Transportation Tuesday: Transit Ridership
Transportation Tuesday this week looks at transit ridership data in metro Atlanta. This interactive dashboard, from the Atlanta Regional Transportation Factbook, shows transit ridership from 1999-2014 for four different agencies (MARTA, CCT, GRTA, and GCT). The dashboard also shows the number of boardings (people getting on the train) by MARTA rail stations. Transit ridership has [...]
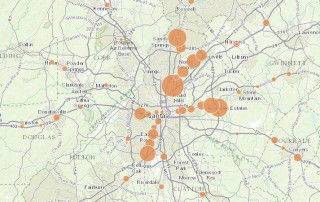
Transportation Tuesday: Park-and-Ride Lots
This week's Transportation Tuesday looks at park-and-ride lots in metro Atlanta. As a Transportation Demand Management (TDM) strategy, park-and-ride lots serve to increase access to transit options by allowing commuters to transfer from their vehicles to transit, vanpools, or carpools. The circles in this map represent park and ride lots and increase in size based on the number [...]
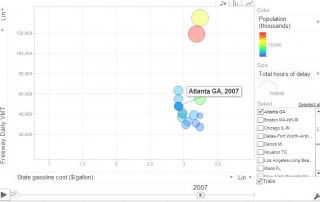
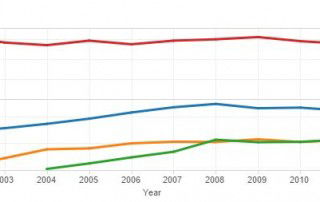
Transportation Tuesday: Gas Prices and Vehicle Miles Traveled
When gas prices go up, do people drive less? This motion chart uses data from the Texas Transportation Institute (TTI) to compare gas prices and vehicle miles traveled for the 15 metro areas TTI classifies as "Very Large." For the time period of 1982-2014, the chart uses the following variables: Daily vehicle-miles of travel (VMT) [...]
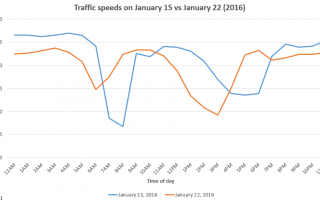
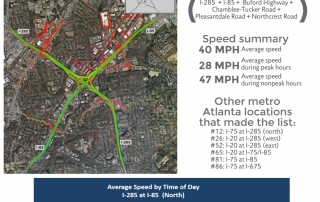
Transportation Tuesday: Gotta Get Home On Friday
This week's Transportation Tuesday compares congestion (travel speed) for the past two Fridays: January 15 (the Friday of the Martin Luther King, Jr. Day weekend) and January 22 (inclement weather with winter conditions). The video below from INRIX shows travel speeds on the interstates in the 10-county metro Atlanta area for January 15 (left side) [...]