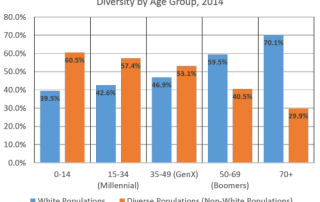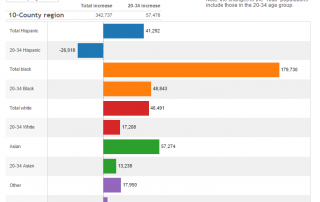
Changes in racial diversity of millennials/young professionals
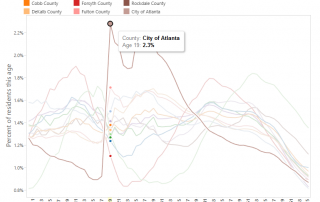
As a whole, metro Atlanta is becoming increasingly diverse—but what about racial and ethnic diversity for millennials/young professionals, age 20-34? Text highlights are below, but scroll down to view trends and county-specific data in our 2010-2015 Population Change by Race: Total Population and Age 20-34 tool. Let’s take a look at overall trends from 2010-2015 [...]