
Regional Snapshot: Hispanic Heritage Month
For October’s Regional Snapshot and in celebration of Hispanic Heritage Month (September 15th-October 15th), we [...]

Transportation Tuesday: Bottleneck Congestion
Where is congestion occurring? Real-time traffic data is used to identify congestion bottlenecks in Atlanta. [...]
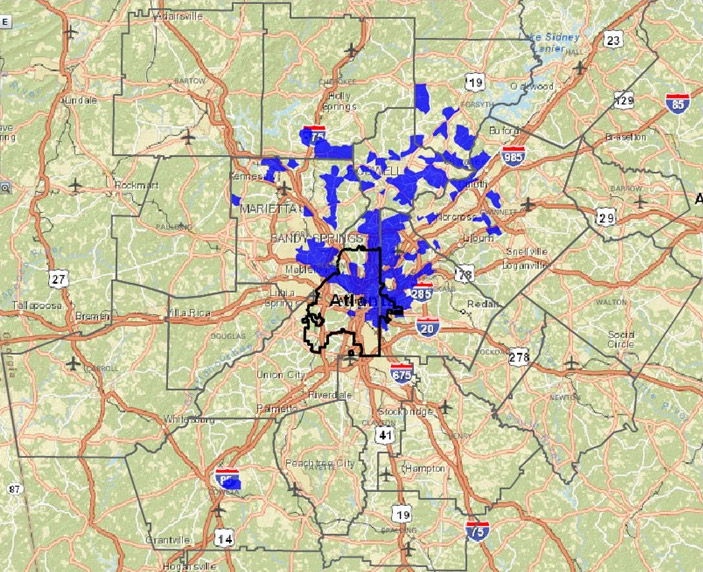
Monday Mapday: Mortgage Loans for Purchasing Homes Per Square Mile
The locations in blue had the greatest number of mortgage loans originated for buying homes [...]

Transportation Tuesday: Atlanta’s Mobility Scorecard
Published by The Texas A&M Transportation Institute and INRIX, the 2015 scorecard analyzes traffic conditions [...]
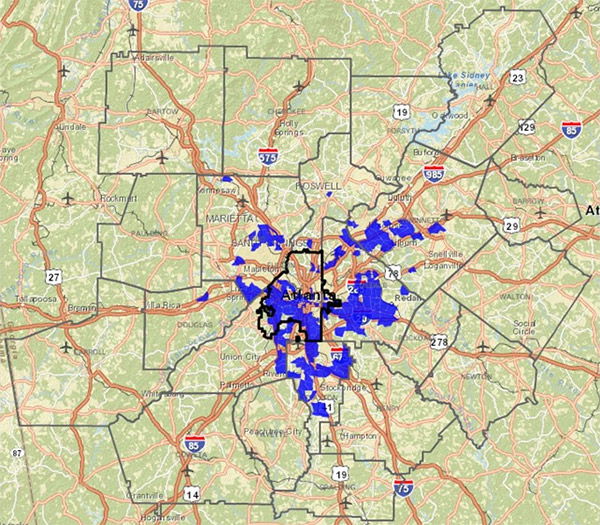
Monday Mapday: Change in the Percent of Hispanic Population
In honor of National Hispanic Heritage Month, this map shows the census tracts with the [...]

Transportation Tuesday: Congestion is Back!
Last month, the U.S. Department of Transportation released its most recent traffic volume trends report, [...]
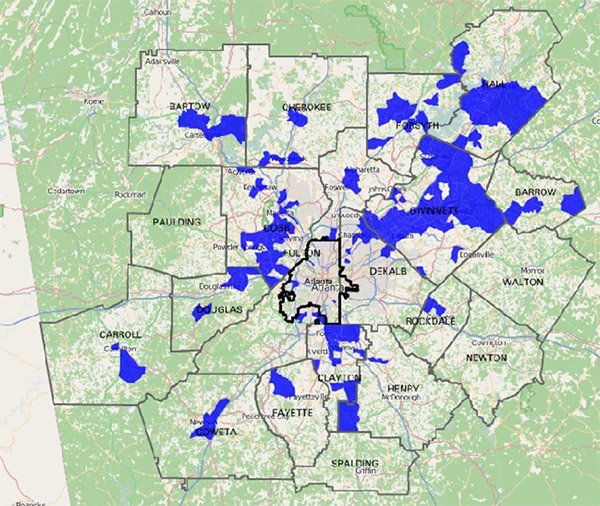
Monday Mapday: Public Assistance through Food Stamps
The areas shown in blue had the greatest increase in individuals receiving food stamps per [...]

Traffic in Metro Atlanta: Just Passing Through?
Personal Trips: Where Are People Going? Vehicle trips that just pass through a [...]
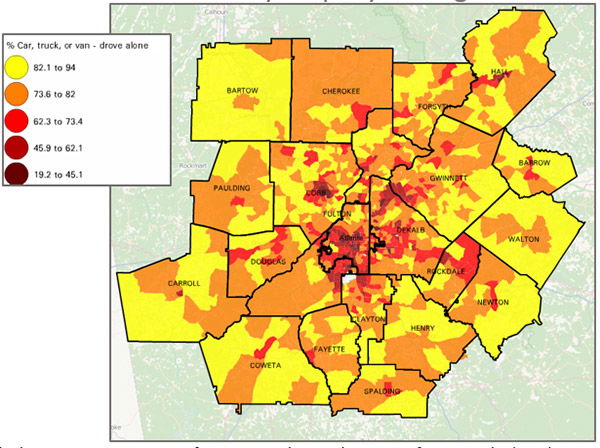
Monday Mapday: Riding Solo
The heaviest concentrations of commuters driving alone come from outside the urban core. It appears [...]

Monday Mapday: Change in Family Composition: 1970-2010
This map comes from September's Regional Snapshot and highlights the areas most affected by the [...]