


Monday Mapday: Veterans in Metro Atlanta
In honor of Veterans Day, this map shows where the most veterans live in metro [...]


Monday Mapday: Demand for Exercise Products / Services
This map shows the market potential for exercise products/services based on the number of adults [...]
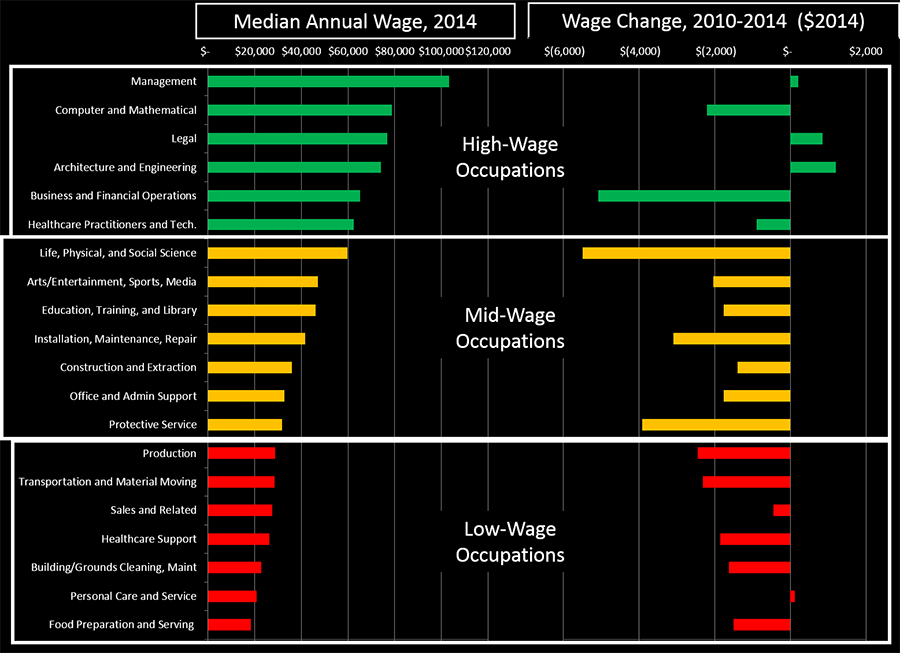
Stuck in the Middle
Amid the rise of income inequality in both the nation and here in metro Atlanta, [...]


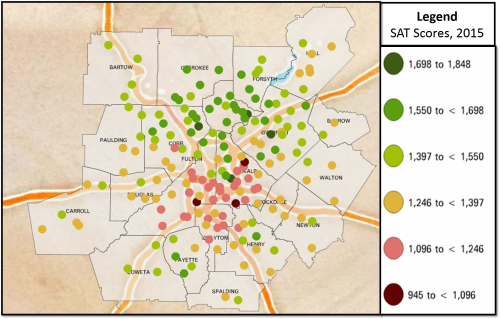
Exploring Latest SAT Scores in Georgia and Atlanta Region
The Georgia Department of Education (DOE) recently reported that high school students in the state [...]


Monday Mapday: Small Business Loans
This map highlights an uneven distribution of small business loans, concentrated in the northern region [...]