
Our quarterly economic publication, The Quarter, is ready! How did our economy do in 2015 Quarter 3? How does it compare to past quarters? Below are some of the highlights or go to the full site to learn more!
All Sectors Employment Change: Construction is the only sector to have decreased in year-over-year change between August and October while all other sectors have increased (Retail has only increased between September and October). Professional/Business had the highest year-over-year change among sectors.
Metro Atlanta continues to outrank the U.S. in total employment year-over-year change. Although recently trending downward, metro Atlanta’s economy is showing resiliency. Its year-over-year total employment has increased from 2.8% in August to 3.5% in October while the U.S. as a whole has remained steady at around 2%.
Employment- Percent Change from Pre-Recession Peak: In October, Metro Atlanta had a 4.5% change from the pre-recession peak.
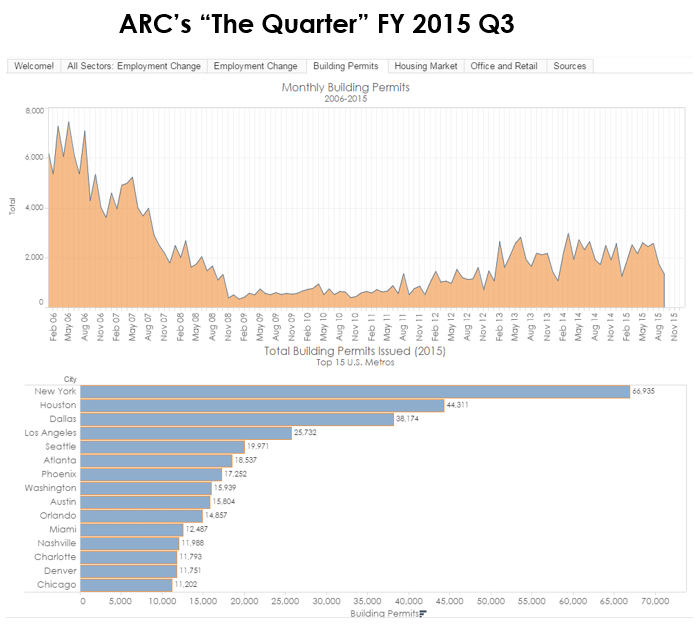
Monthly Building Permits: Monthly building permits have decreased from 2,579 permits in July to 1,349 permits in September. This is consistent with the decrease in construction in the 3rd quarter.
Total Building Permits Issued: While building permits in metro Atlanta have increased by more than 5,000 between 2nd and 3rd quarter, Atlanta has fallen from 5th to 6th among the top 15 U.S. metros during this time.
ATL Case-Shiller: Atlanta’s Case-Shiller Index has increased incrementally during the 3rd quarter and is now leveling out. When compared to the 20-Metro Composite, metro Atlanta remains 8th in Home Price percentagesince the pre-recession peak. But while Atlanta’s index ranking remains the same between the 2nd and 3rd quarters, its index has improved from -.08 to -.07.
CoStar: Office and Retail: Both Office Net Absorption totals and Under Construction Retail buildings have decreased between Q3 and Q4. The vacancy rates have also decreased between quarters.