
Special Features
Reports, maps, and infographics about special topics.
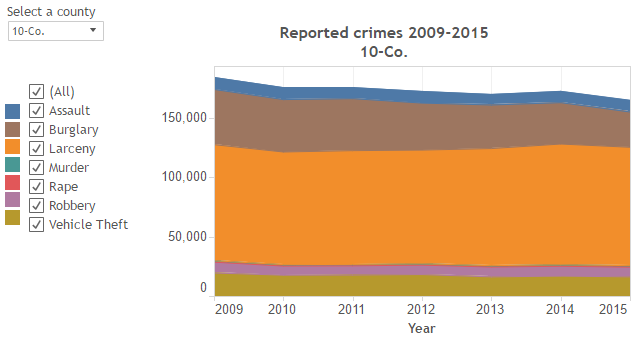
Crime in the Region: Perception (Metro Atlanta Speaks) + Trends (FBI Reports)
A growing share of respondents to the Metro Atlanta Speaks survey rate crime as the biggest problem for the region; yet, the survey also reveals that respondents consider crime a greater issue at the [...]

2017 Data Bowl
Atlanta vs. Boston How does Atlanta compare to Boston? We'll let the football facts be decided on the field, but we check out some socioeconomic and demographic numbers here. For more on the [...]

Diversity Index
Neighborhoods in Gwinnett County ranked the most diverse in the state Metro Atlanta is becoming increasingly diverse, a change that can be seen in local school districts, the racial/ethnic makeup of millennials, and racially [...]

Poverty rates decreasing following a 2012 peak
In 2015, 14.1% of residents in the 10-county metro Atlanta region were living in poverty. When looking at rates from 2006 - 2015, all but one county in the region hit a peak poverty rate in [...]

The Food Insecure in Metro Atlanta – A Deep Dive into Metro Atlanta Speaks
For most of us, Thanksgiving is a time to celebrate with our families over an abundance of food and reflect on the many reasons we have to give thanks. Whatever the particular traditions are, food [...]

Where are the Voters? Voter Registration and Turnout in Metro Atlanta (2004 to 2012)
Election Day is just 39 days away and there are only 12 days left to register to vote. We are taking a timely look at voter data from the last three Presidential elections. In 2012, there were [...]