
Special Features
Reports, maps, and infographics about special topics.
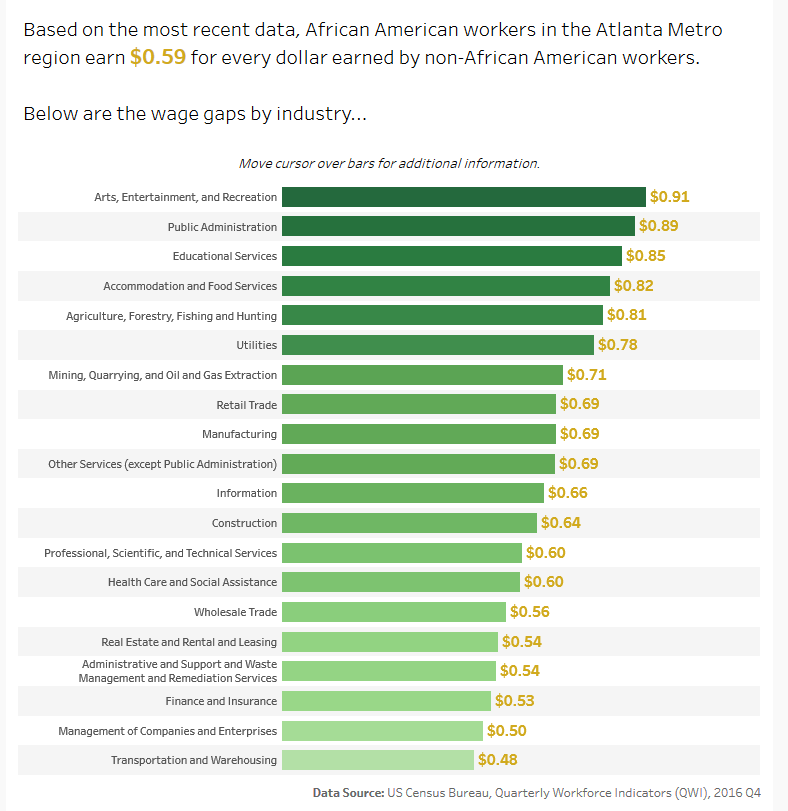
Equity Special Feature: Race & Earnings in the Atlanta Metro Region
ARC's Research & Analytics Group will be publishing a series of Special Features on equity over the next few months. Posts in the Equity Series will examine a variety of aspects of equity along [...]

Friday Factday: A Toy (Spending) Story
The holiday season is upon us! It is a time for festivities and gift giving among friends and family--which means an increase in household spending. According to polling by Gallup, average holiday spending per [...]
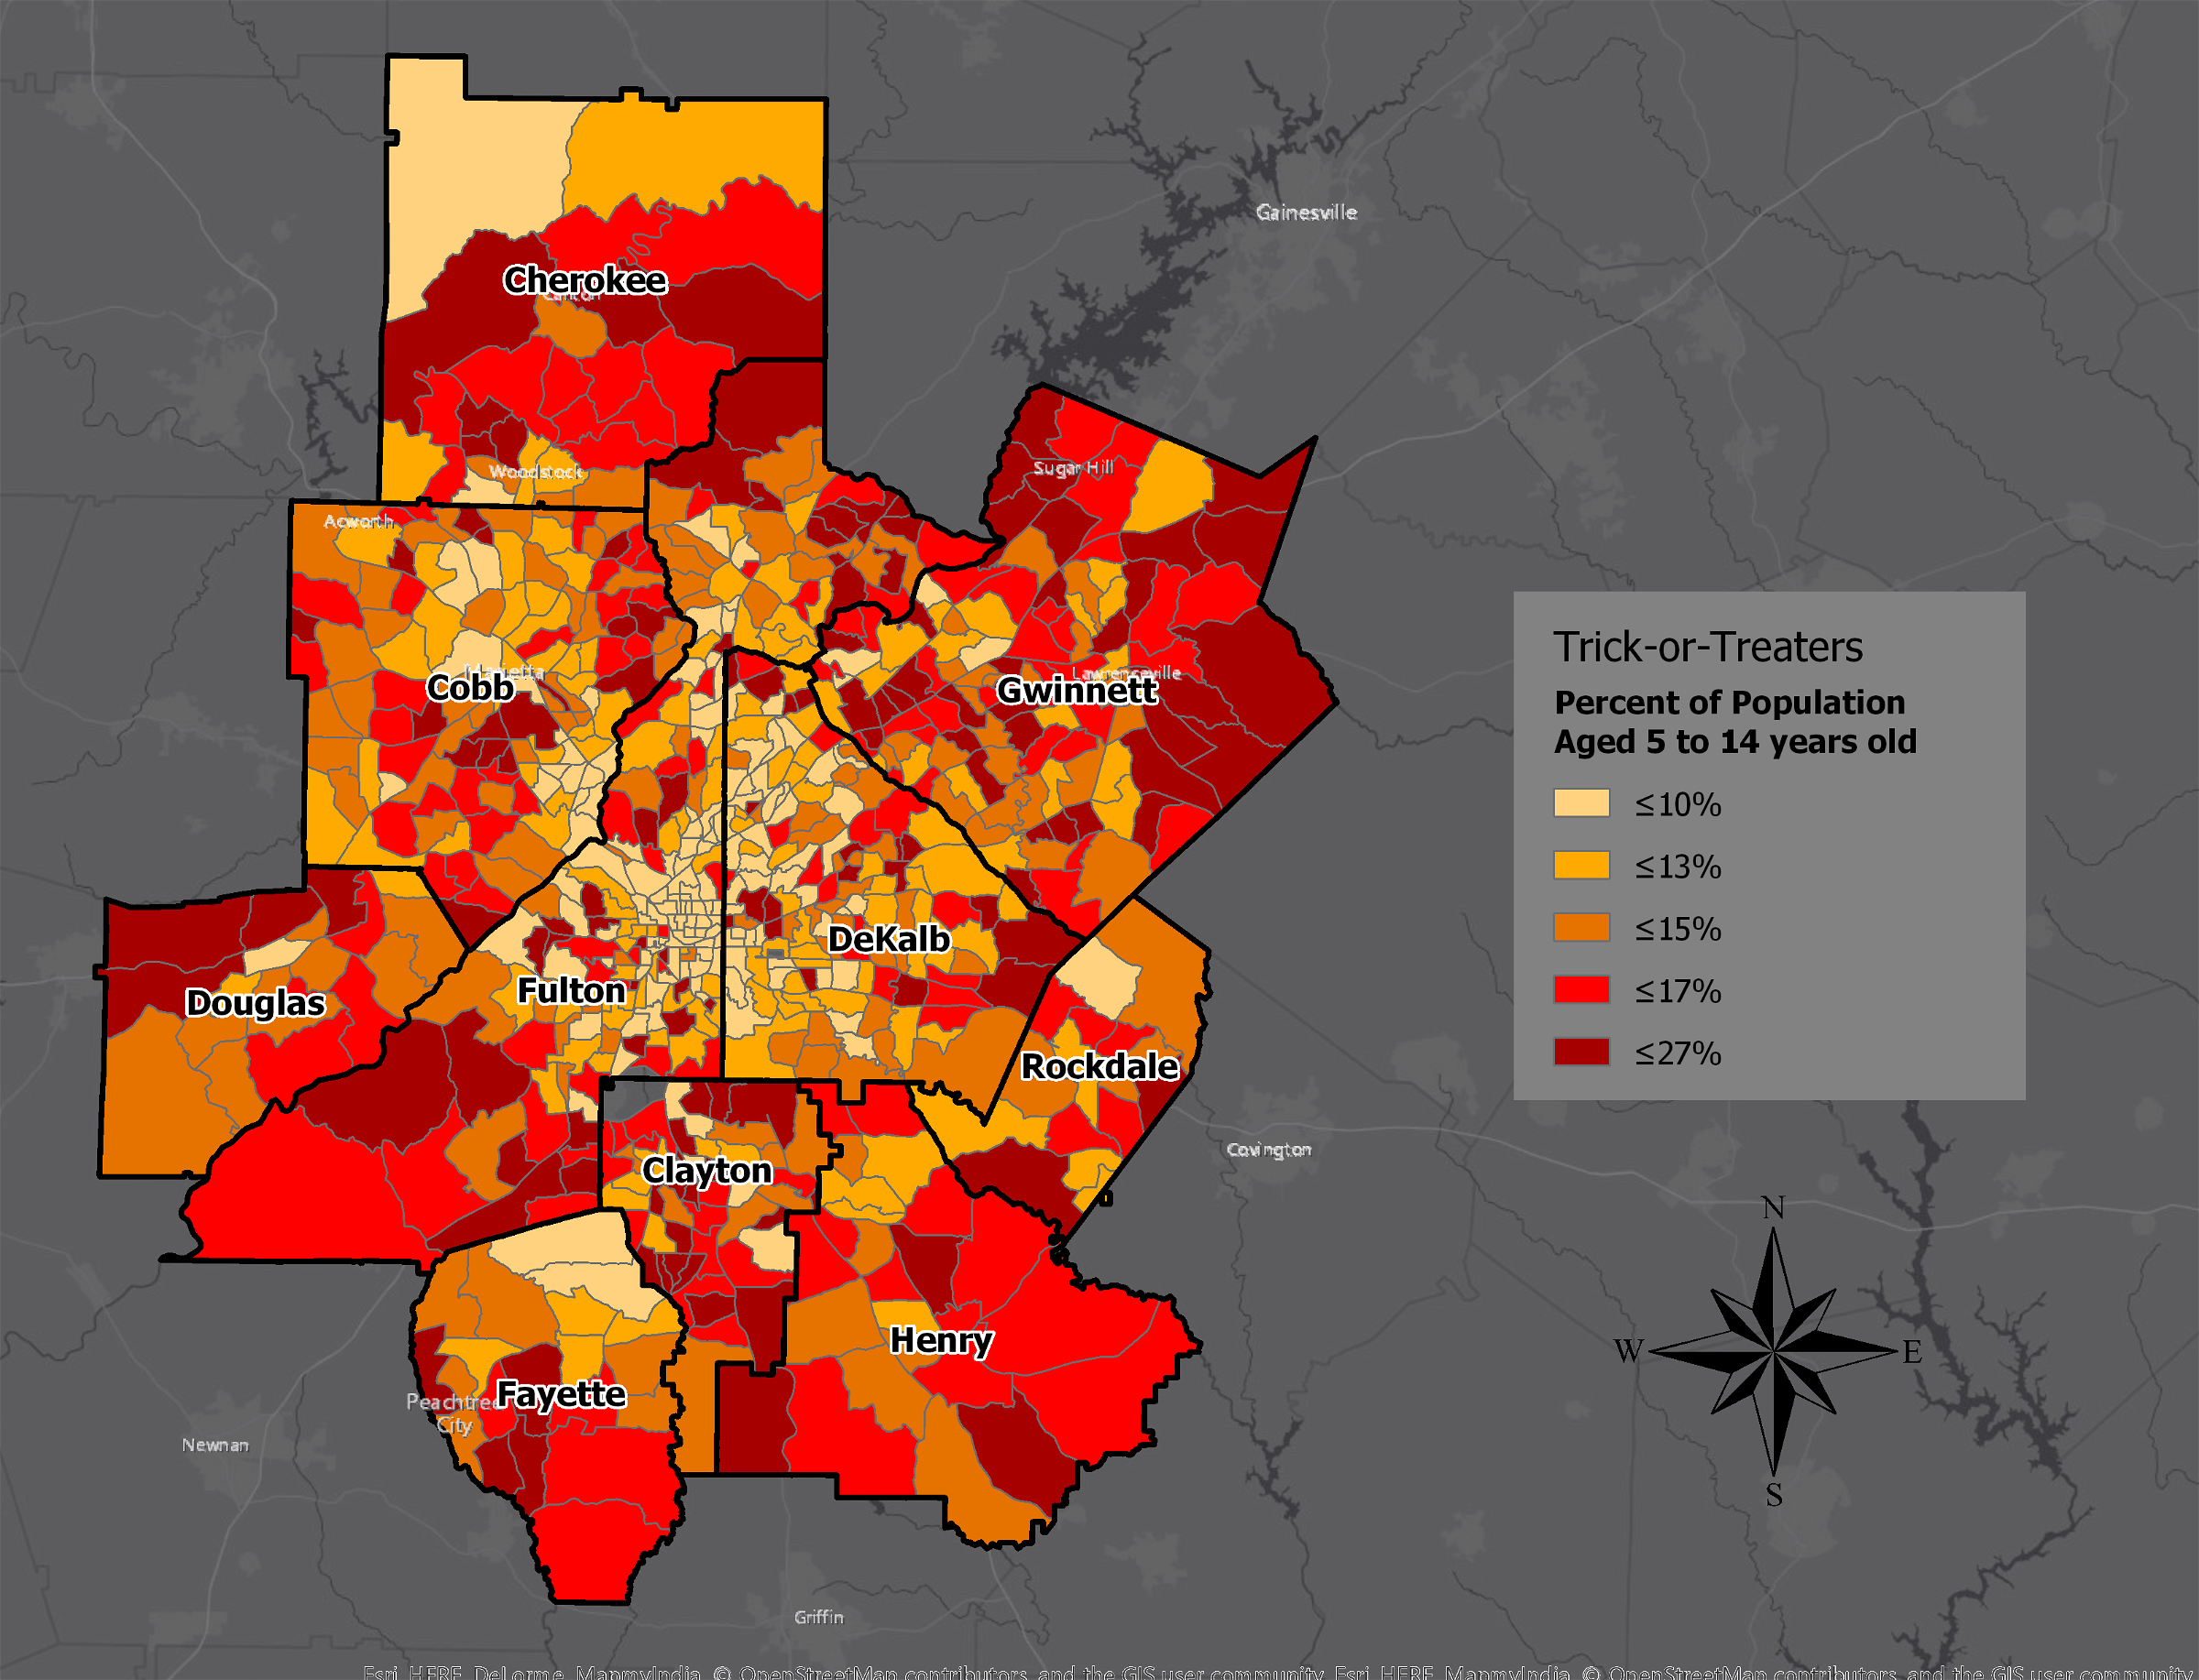
Monday Mapday: Hoards of Trick-or-Treaters in the Metro Region
Tomorrow is Halloween, and to get you in the spirit, we've created a map showing the highest concentrations of potential trick-or-treaters. With the exception of a few neighborhoods in the central cities of Atlanta [...]

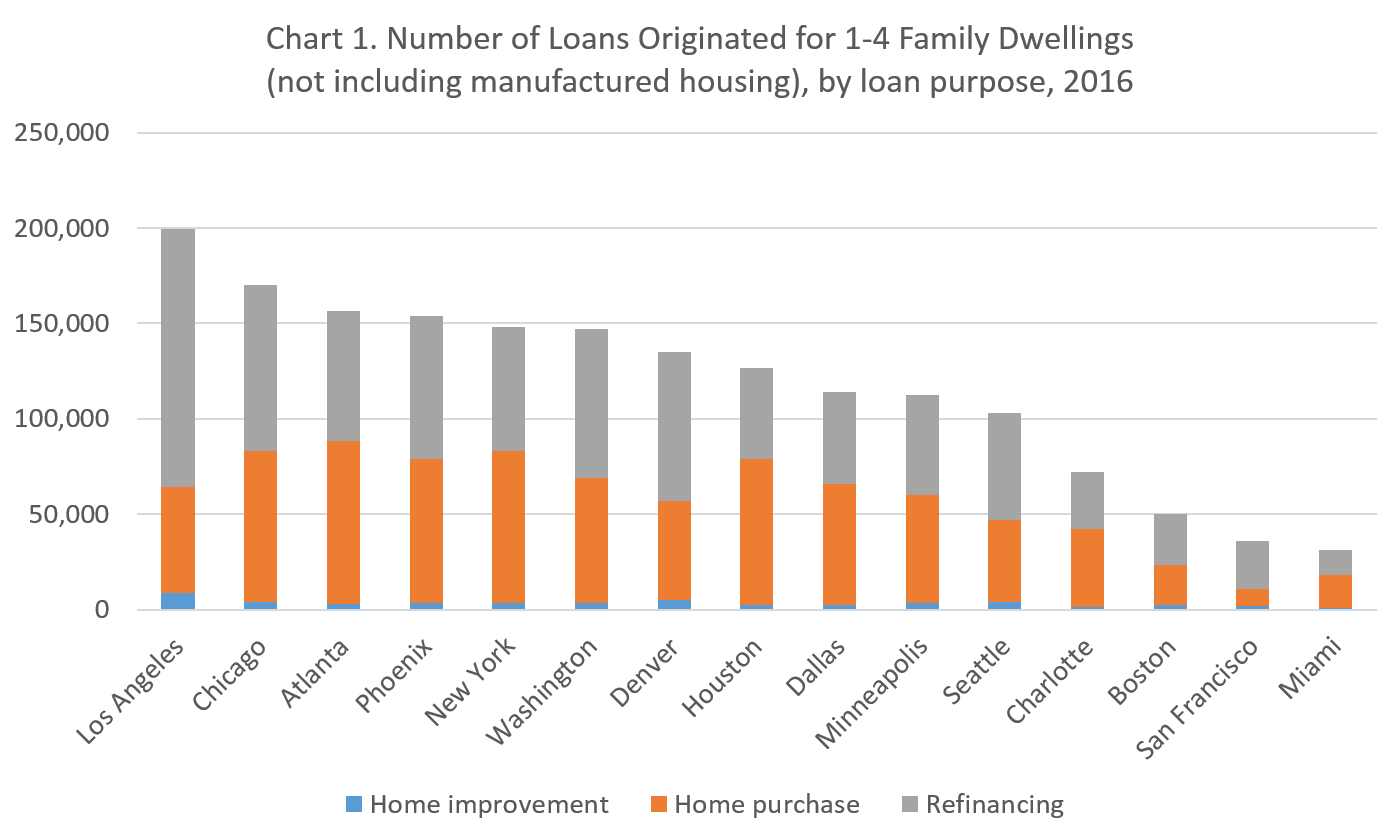
Metro Atlanta a National Leader in Home Loans
We spend a lot of time analyzing data about the region’s housing market. We have examined how home prices have recovered since the Great Recession (here) and we recently looked at the growing affordability [...]
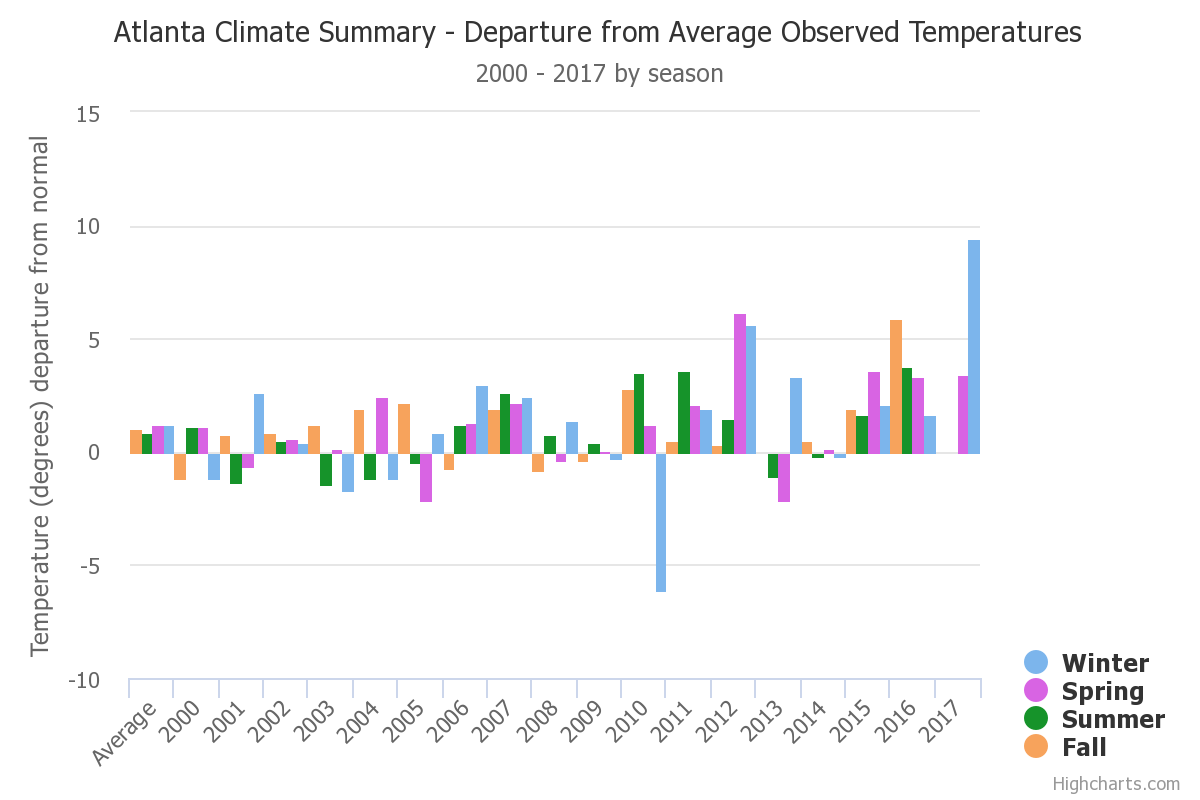
Hotlanta: Temperature Changes 2000-2017
Update through June, 2017: June 2017 was the first month with a below average temperature (-0.2°F) in Atlanta since January 2016! That's 16 months in a row of above average temperatures. What led [...]