
ARC’s Research & Analytics Group is publishing a series of Special Features on equity over the next few months. Posts in the Equity Series will examine a variety of aspects of equity along with some of the key factors hindering the realization of this ideal in the Atlanta Metro region. Each post will focus on data and data visualizations designed to clearly convey the aspect of equity being discussed.
For this third post in the Equity Series, we look at the relationship between economic mobility and education. The Equality of Opportunity Project , an equity-oriented research collaborative headed in part by the economist Raj Chetty of Stanford, has attempted to track the economic mobility of individuals by comparing the economic bracket of a person’s childhood to the economic bracket they attain in their adult life. Additionally, researchers working on this project have examined the impacts that race, geography, quality of education, and other factors might have on people’s likelihood of moving up economically over the course of their lives. One of the more striking results of their analysis, at least to our readers, is that the level of economic mobility in the Atlanta metro region is estimated at not only the lowest in the U.S. but also at a lower level than in any of the developed countries for which data was available at the time of the study. Using data from Chetty et al.’s 2014 article, “Is the United States Still a Land of Opportunity? Recent Trends in Intergenerational Mobility,” published in American Economic Review Papers and Proceedings, the chart below provides a visualization of the extent to which someone born in Atlanta into a household in the bottom 10th-percentile in terms of earnings is likely to improve their economic prospects as an adult. Only 4% of Atlanta metro residents born into the bottom 10th-percentile of income will make it to the top 20th-percentile in adulthood–that’s the second lowest economic mobility rate in the country.

As generally known, a person’s economic prospects are largely influenced by his or her level of educational attainment. As part of their Economic Mobility Project, which has the goal of increasing postsecondary education, the Brookings Institute found that individuals raised in poor and low-income families who subsequently earned a college degree were indeed more likely to move up the economic ladder than were others in that same baseline situation that did not get a college degree. The chart below, using data from the Bureau of Labor Statistics (BLS) for 2017, shows the national unemployment and median weekly earnings by level of educational attainment. As you can see, the prospect of unemployment and lower wages declines with each level of degree attainment.
 US")
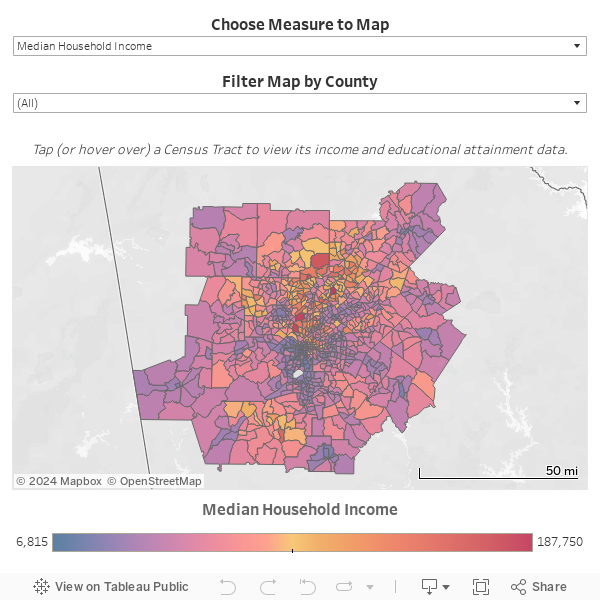
To help examine this relationship more closely in the Atlanta Metro region, we created the map explorer below. It allows for comparison of census tracts by median household income and levels of educational attainment. After choosing an indicator to map, simply tap or hover over a census tract to see that tract’s median household income along with shares (of all individuals 25 years and older) attaining each level of education.
Drill down even further with Neighborhood Nexus! This site hosts a suite of interactive maps containing data for all public Elementary, Middle, and High schools across the state of Georgia. A quick glance at these maps reveals spatial patterns in educational outcomes by school. As one would expect, schools with higher numbers of students in poverty are more likely to report lower levels of educational proficiency. With this is mind, schools which perform better than expected (given area levels of poverty) might offer models for turning the tide on the generational poverty attributable to educational attainment. The Atlanta Public School (APS) system created the Beating the Odds platform to identify these potential model schools as well as those performing below expectations, by comparing each school’s proficiency scores to other schools with similar* students.
* Student similarity was determined along the lines of race/ethnicity, family income, disability, English proficiency, mobility, and school size and type.