At the start of another world-shifted week, it’s worth taking stock of where we have been, where we are, and how we are handling COVID-19. For all the vast economic and social suffering that coronavirus has brought the planet and our nation, there’s been progress globally in fighting this pandemic. Closer to home, 31 states are reopening to some extent this week, though there are theories (and data) that suggest that doing so now might not be the most prudent course.
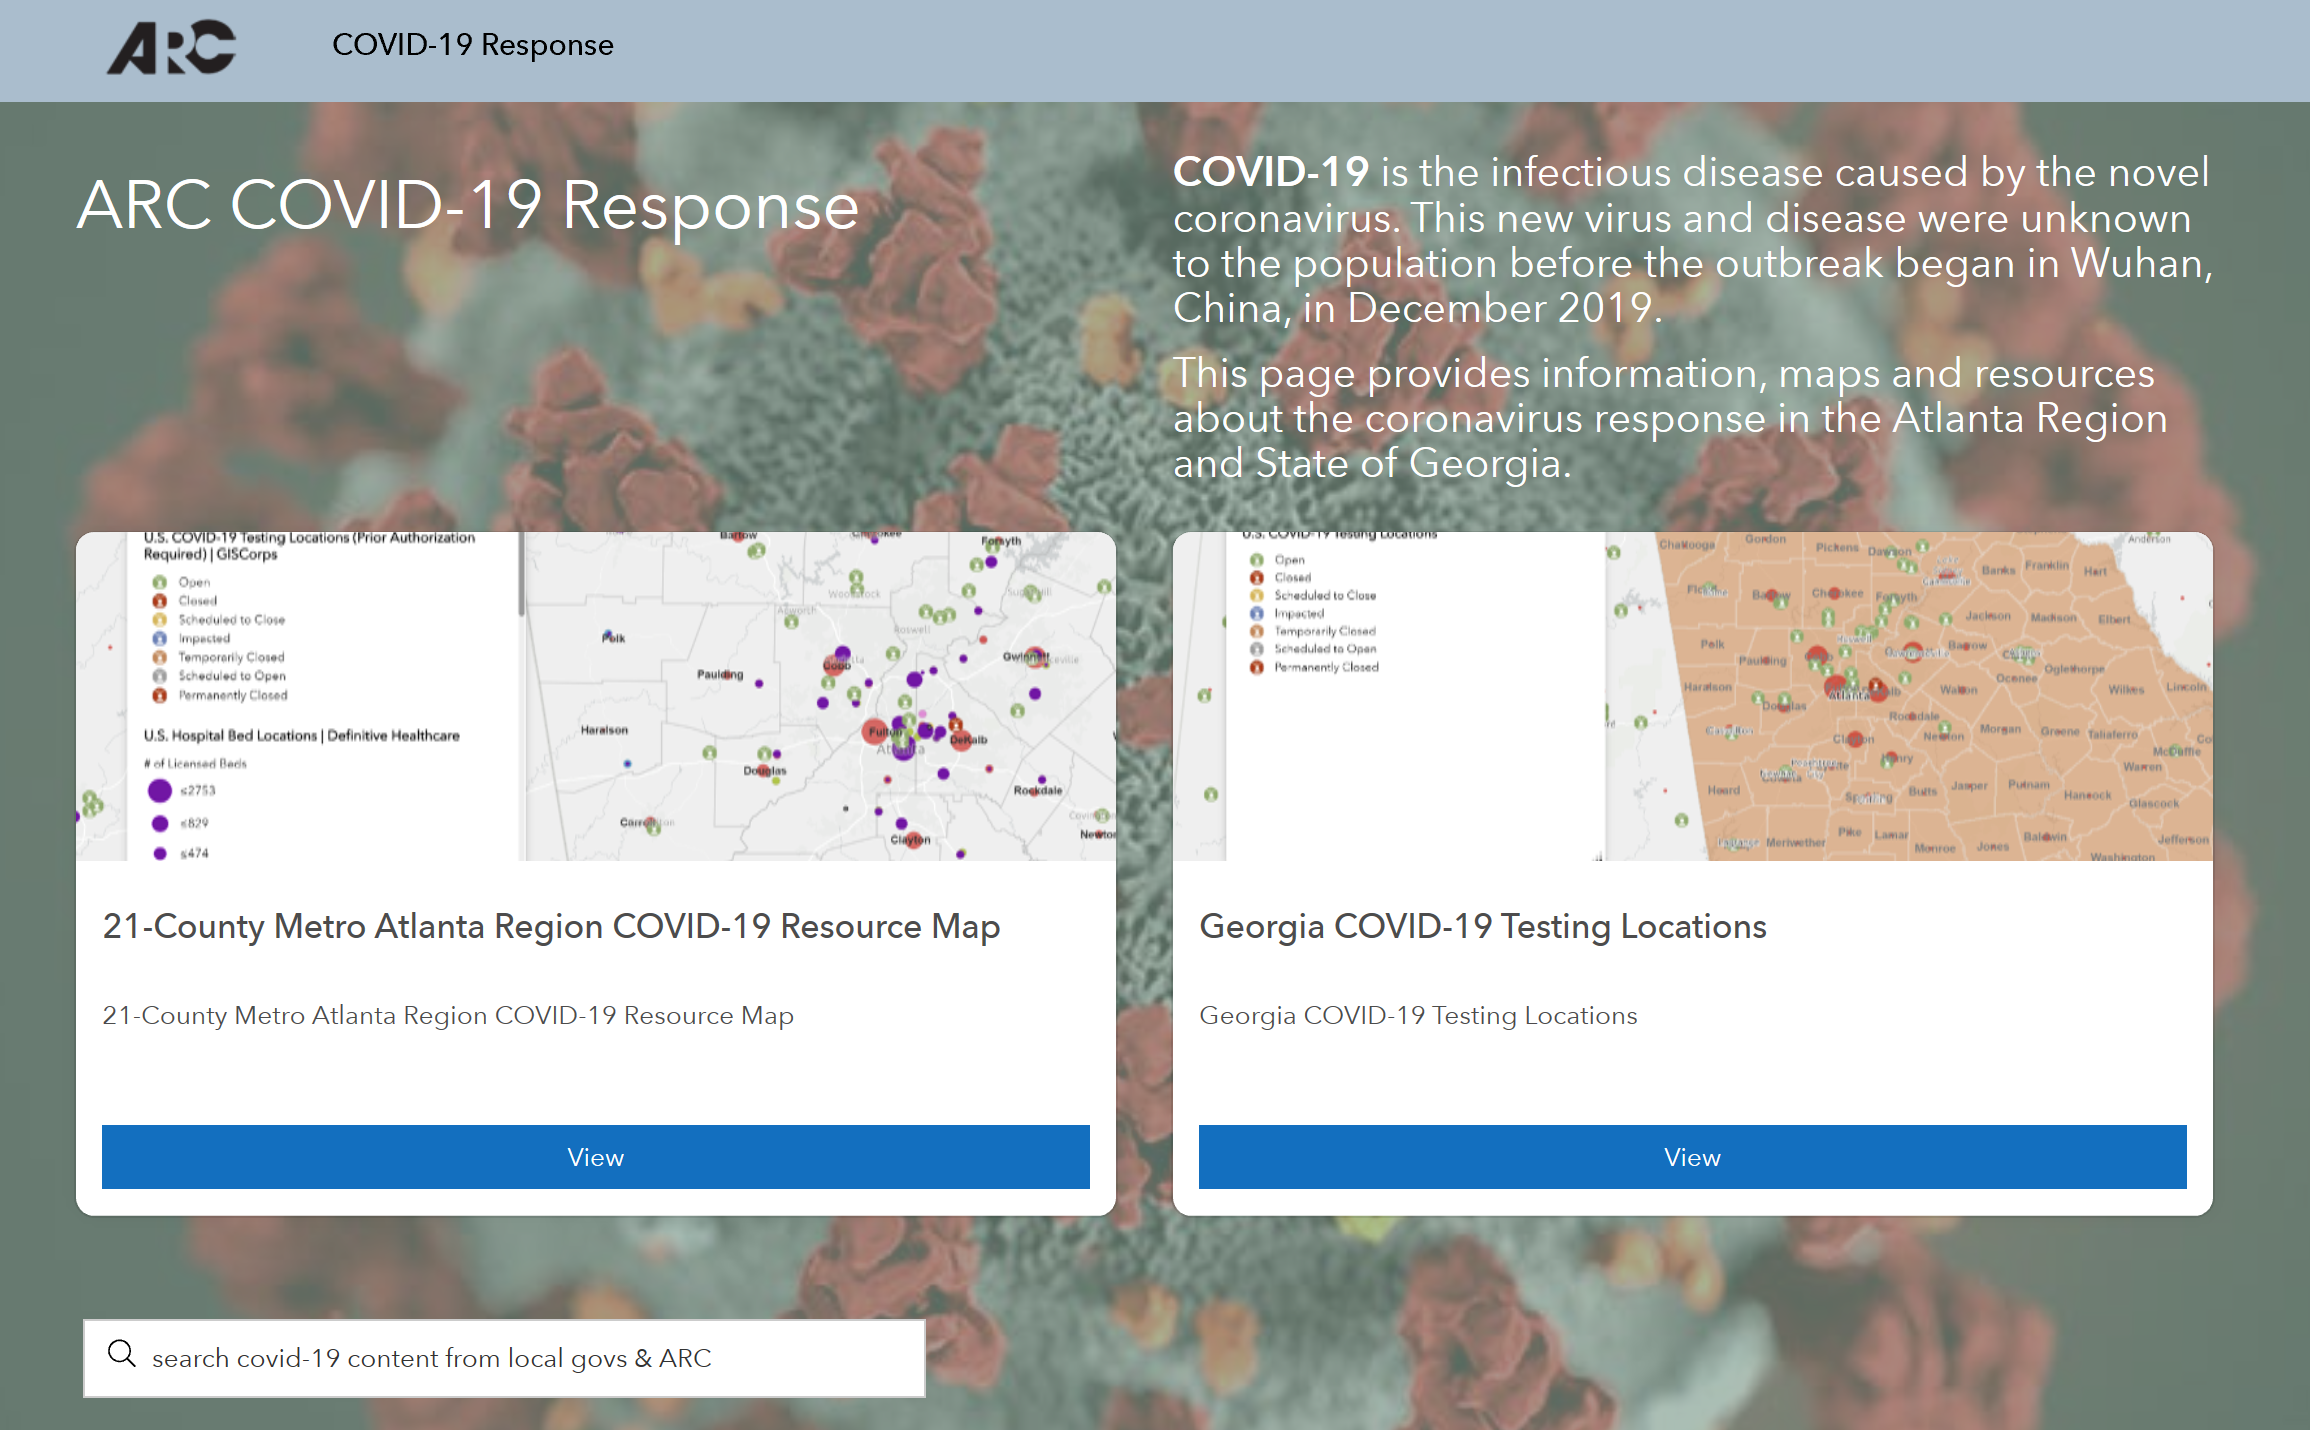
Speaking of data, we ‘circle the wagons’ this Monday with reminders for you (or maybe a first heads up for some) of webpages that the Atlanta Regional Commission (ARC) has built to house maps, analysis tools, and resources dealing with COVID-19. While most of the tools on these pages were built by ARC, a great amount of the data seedking them come from federal, state, and local partners. Up first is our Open Data & Mapping Hub , which has been for quite a few years now a matchless repository of regional and state spatial and attribute data . A COVID-19 page now features prominently on the Open Data Hub. You can preview the virus-specific page in the image below, and access it by clicking on that screen capture.
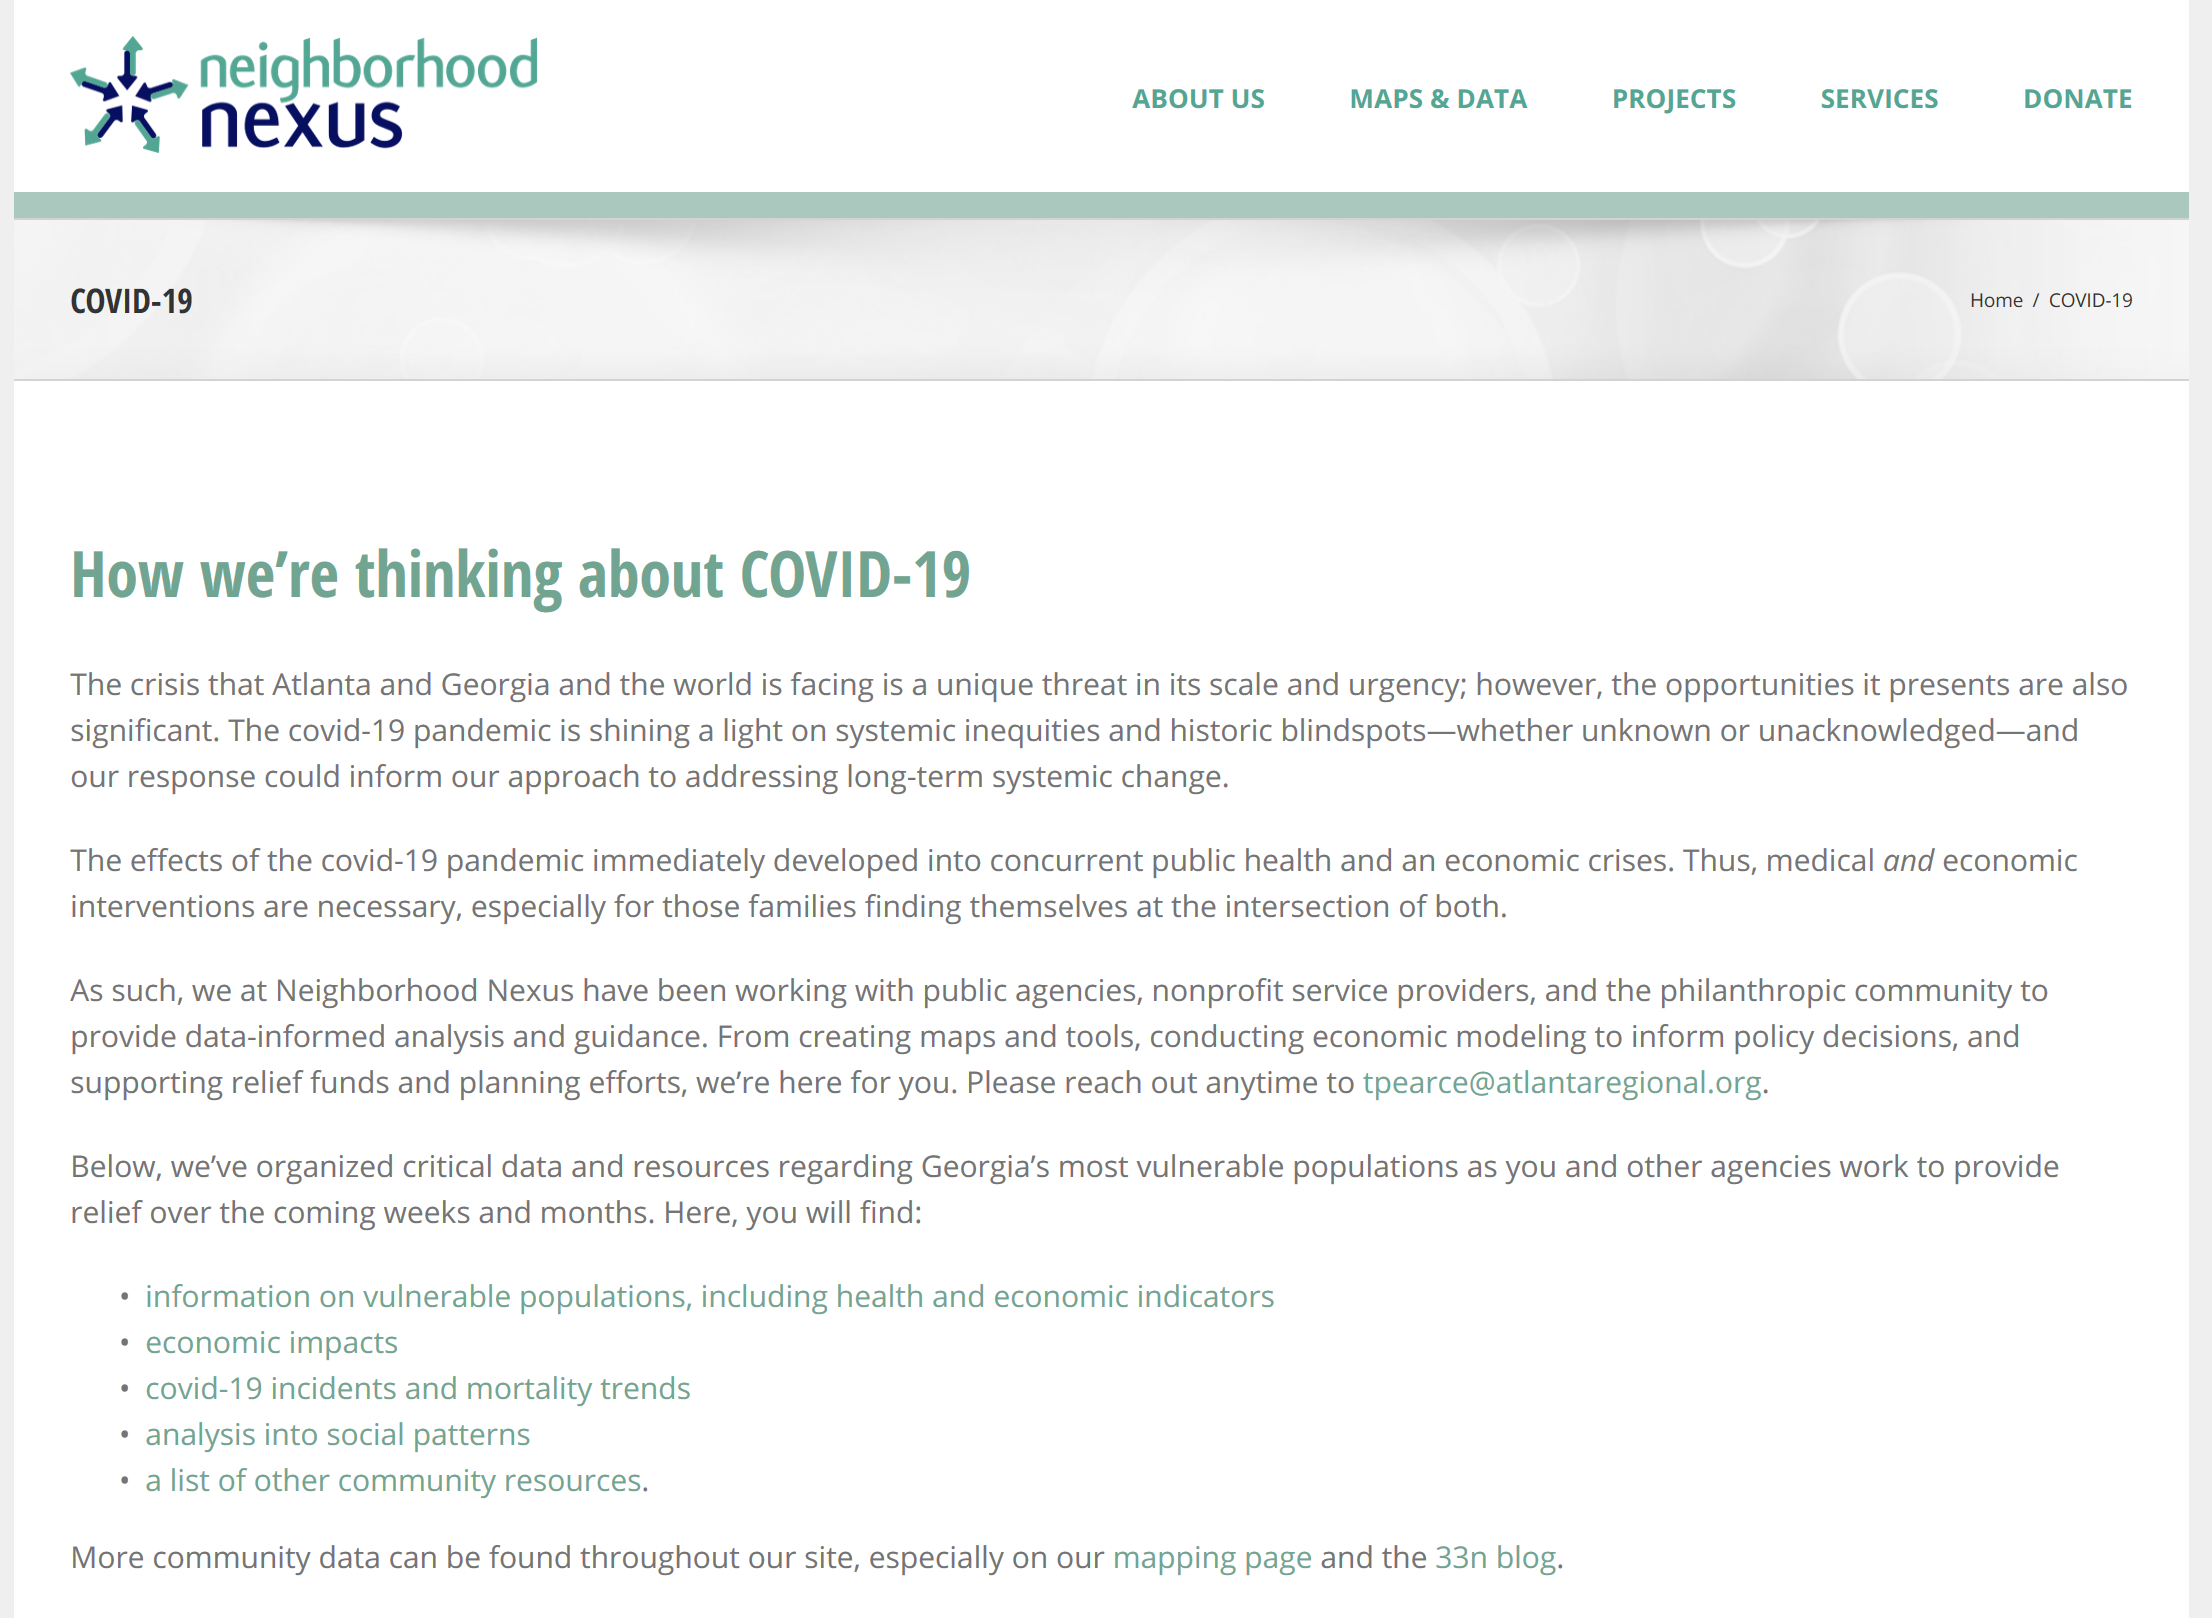
Neighborhood Nexus, staffed by ARC Research & Analytics, is a data outreach partnership of ARC, the Community Foundation for Greater Atlanta, the United Way of Greater Atlanta, and the Metro Atlanta Chamber . Nexus recently launched a website redesign. A leading edge of this site refresh was the development of a COVID-19 page for the site. You will find there some of the same data provided on the Open Data site. But on the Nexus page (also linked to in the image below), there are quite a few different twists and turns that, for you, might make this a more friendly portal point. Also on the Nexus site, here, there are a host of other maps and data that will help you understand the region (as well as better grasp the likely impacts of COVID on the region) .
Thirdly, our agency’s main Atlantaregional.org website’s page for COVID-19. Specific features of this page include resources targeted to local governments, as well as links to ARC-hosted topical webinars on elements of the crisis. Initial takes on the economic development and transportation impacts of the virus kicked off that series. Coming very soon is a webinar on inclusive community engagement. Check out, again, all that this page offers by clicking on the image below.

And finally, we have built quite a few other tools, that have seeded some really interesting blog posts, that are not yet included on any of the pages that we have presented above. Some recent standouts are as follows:
Social Distancing: The Spatial Situation over Time
Watch this blog for more to come, starting with a planned ‘one-stop data summary’ very soon . We will look at all the data, and more importantly continue to get through this, together.
Important Dates
2020
- March 12: People started receiving Census information about how to respond and will be “invited” to participate either online or by paper questionnaire.
- April 1: Census Day is observed nationwide. When you respond to the census, you’ll tell the Census Bureau where you live as of April 1, 2020.
- April 8: Reminder letters and forms sent to those who haven’t responded start arriving
- May – July: Census takers will begin visiting homes that haven’t responded to the 2020 Census to help make sure everyone is counted.
- August 14: The last day to respond for most people. You can complete your Census questionnaire here.
- December: The Census Bureau will deliver apportionment counts to the President and Congress as required by law.
2021
- March 31: By this date, the Census Bureau plans to send redistricting counts to states. This information is used to redraw legislative districts based on population changes.
How Georgia is doing?
As of March 31st, only about 33 percent of Georgians have self-responded to the 2020 Census, just under the national level of 34 percent. The Urban Institute projects that as many as 177,000 Georgia residents may be undercounted in 2020. Low response rate may result in bias results with poor data quality. For the 2010 Census, the response rate in Georgia was 62.5 percent, which was lower than the national average response rate (66.5 percent). The speed and extent of the spread of coronavirus, along with social distancing procedures, pose a unique challenge for data collection in the 2020 Census. Without concentrated efforts, 2020 response rates could fall quite a bit from 2010 levels. Undercount, and underfunding, could be the result.
Source: U.S. Census Bureau