The most recent release of Small Area Income and Poverty Estimates (SAIPE) provides us with a window onto the first year of the pandemic and simultaneously allows us to see its economic impact in historical perspective.
About the data: Every year since 2005, the Census Bureau supplements American Community Survey (ACS) data with administrative data such as income tax and food stamp data, allowing production of single-year estimates — even for small counties. By contrast, single-year estimates based solely on the ACS provides single-year estimates only for geographies with 65,000 population or more, or only 37 of Georgia’s 159 counties.
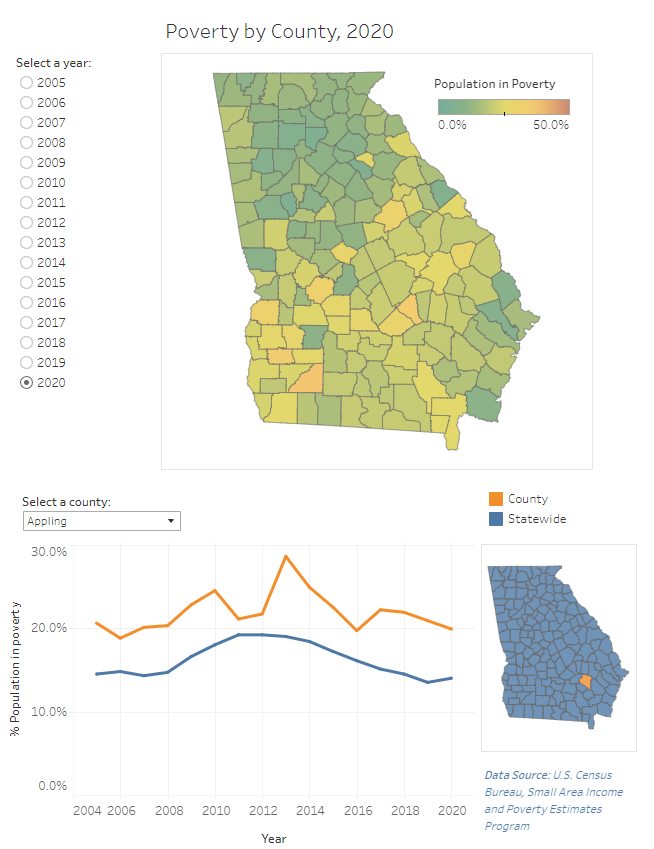
The animated map below traces the percentage of the population in poverty by county over the period 2005 to 2020, and the graph following it presents the statewide rate over time. We see that the poverty rate statewide spiked to 19.2% during the great recession, and then declined steadily until it was roughly one percentage point below pre-recession levels in 2019. And a few counties (Calhoun, Stewart, Telfair, and Wheeler) experienced poverty rates in excess of 40 percent at the height of the Great Recession. By contrast, the statewide poverty rate ticked up only slightly in 2020 from 2019 statewide, and poverty rates in many counties were either flat or slightly down. This is an indication that the bipartisan CARES Act passed in March, 2020 was effective in preventing a massive increase in poverty.
Of course, counties differ greatly in terms of their base poverty rates, how quickly they recovered from the Great Recession, and how vulnerable they were to economic effects of the pandemic. To explore more, take a look at our visualization diving deeper into county-level SAIPE data.