
What parts of our region and which sectors fared best during the COVID-19 pandemic? Which will likely be slowest to recover? Though the pandemic itself was unprecedented, one can look at the experience of another recent crisis—the Great Recession—to identify what areas and groups are most vulnerable. We use the Longitudinal Employer-Household Dynamics (LEHD) data, a joint project between the U.S. Census Bureau and the state departments of labor around the country, to help answer these questions.
In order to facilitate comparison between groups with disparate numbers, we have indexed each indicator against its value just before the start of the Great Recession (2007 value = 100). For example, in the screenshot below, we see that with 19,825 total jobs in 2020, the SE DeKalb superdistrict had 96.4% of the number of jobs that it had in 2007. By comparison, the 11-county ARC region had 15% more jobs in 2020 than in 2007 (i.e. an index value of 115). Click on the picture to access the tool, or read on!
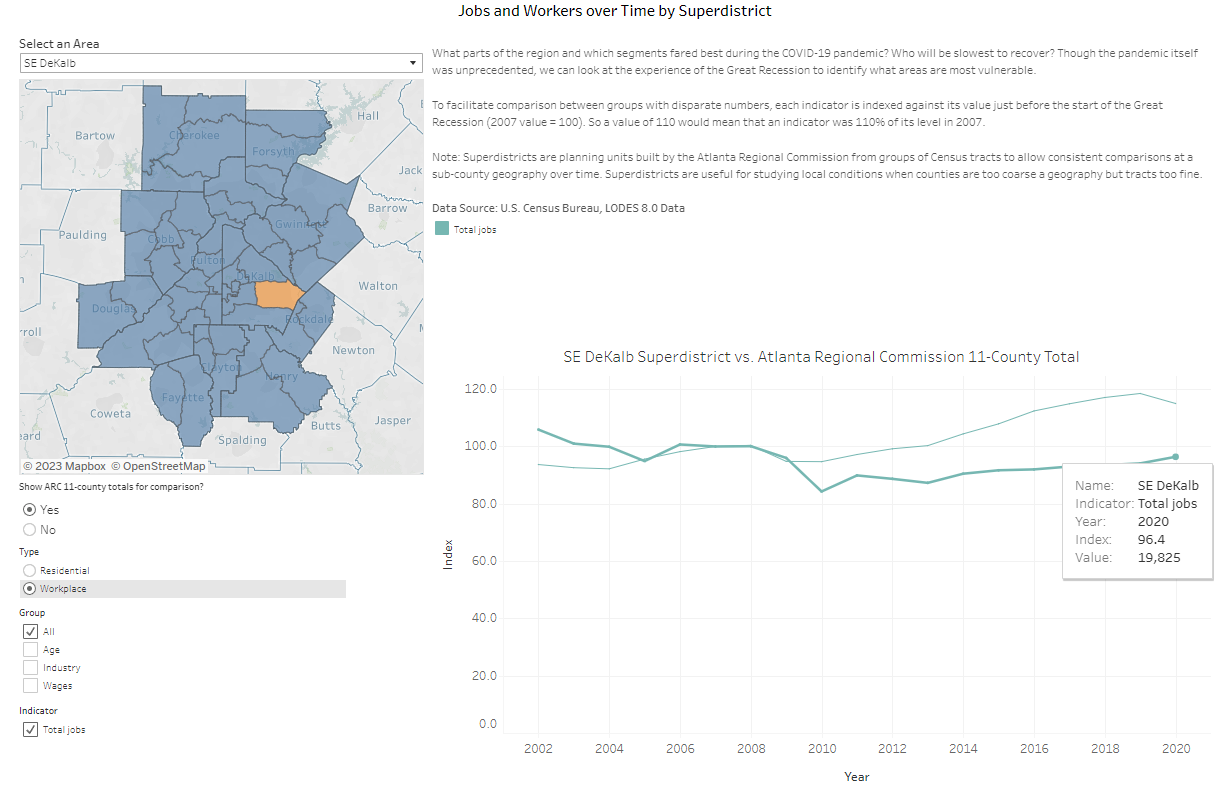
The visualization tool allows comparison between different age, industry, or wage categories as well as for overall totals. You may examine jobs either by “residential characteristics” (where workers live) or by “workplace characteristics” (where workers work). Data are presented for the 52 Superdistricts in the Atlanta Regional Commission’s 11-County region as well as the ARC region as a whole. Note that Superdistricts are planning units built by the Atlanta Regional Commission from groups of Census tracts to allow consistent comparisons at a sub-county geography over time. These Superdistricts are useful for studying local conditions when counties are too coarse a geography but tracts too fine.
Explore the data here: https://public.tableau.com/app/profile/moshe.haspel/viz/JobsandWorkersoverTimexSuperdistrict/Dashboard