You don’t need a weatherman to know which way the wind blows, and you certainly don’t need a thermometer to know that it is hot in Atlanta during the summer months. Indeed, a recent blog post here on 33°n explored the historical trend of the number of extreme heat days in Georgia over the last three decades, finding that the average number had doubled over that period. So, what communities are most vulnerable to these episodes of extreme heat, and where is the population more set up for “resilience”? To examine this question, we turn to a new data set from the U.S. Census Bureau, Community Resilience Estimates (CRE) for Heat, produced in collaboration with researchers at Arizona State University.
The CRE for Heat makes use of individual-level data from the American Community Survey, scoring each respondent’s vulnerability level according to 10 different risk factors. These risk factors include: financial hardship, as people may not have access to air conditioning or be able to afford the electricity to keep it running; age over 65, as older people have more trouble regulating body temperature ; and reliance on public transportation, as this involves people who will be out walking on the sidewalk (hotter than a match head). The researchers who constructed these estimates classify people with three or more of these ten risk factors as socially vulnerable. Using these data, a recent Census brief finds that 23.8% of individuals nationwide are socially vulnerable to extreme temperatures.
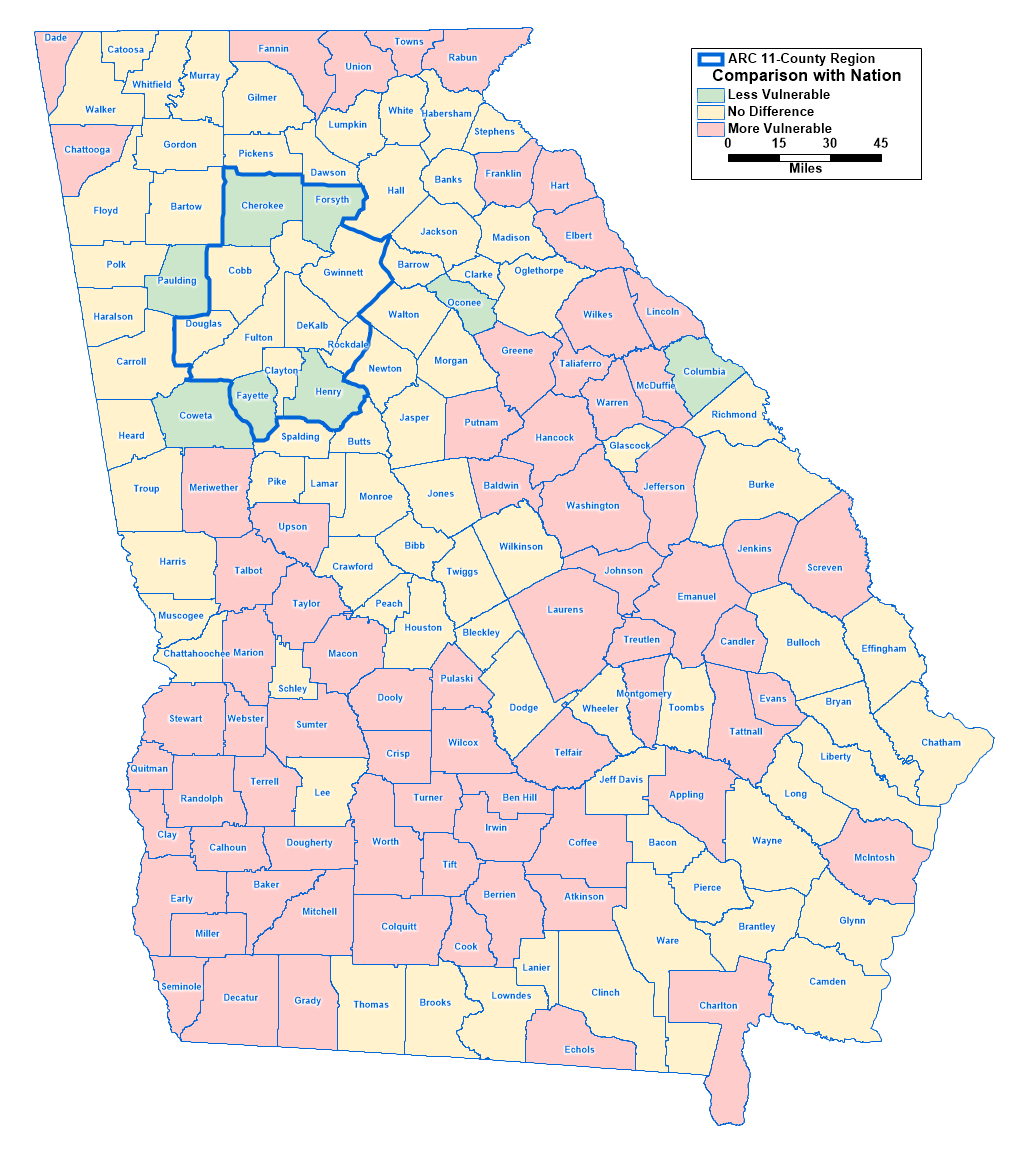
How do Georgia and the Atlanta region compare? Figure 1 below shows that the populations in four of the 11 counties in the ARC region are less vulnerable than the nation as a whole, while any differences observed between the national average and the remaining seven are not statistically significant. At the same time, however, 71 of Georgia’s 159 counties represent communities more socially vulnerable than the nation as a whole. And most of these are located in South Georgia, the region with a warmer climate to start with:
Figure 1: CRE for Heat– County to Nation Comparisons (Source: Census Bureau CRE for Heat, ARC Research & Analytics)

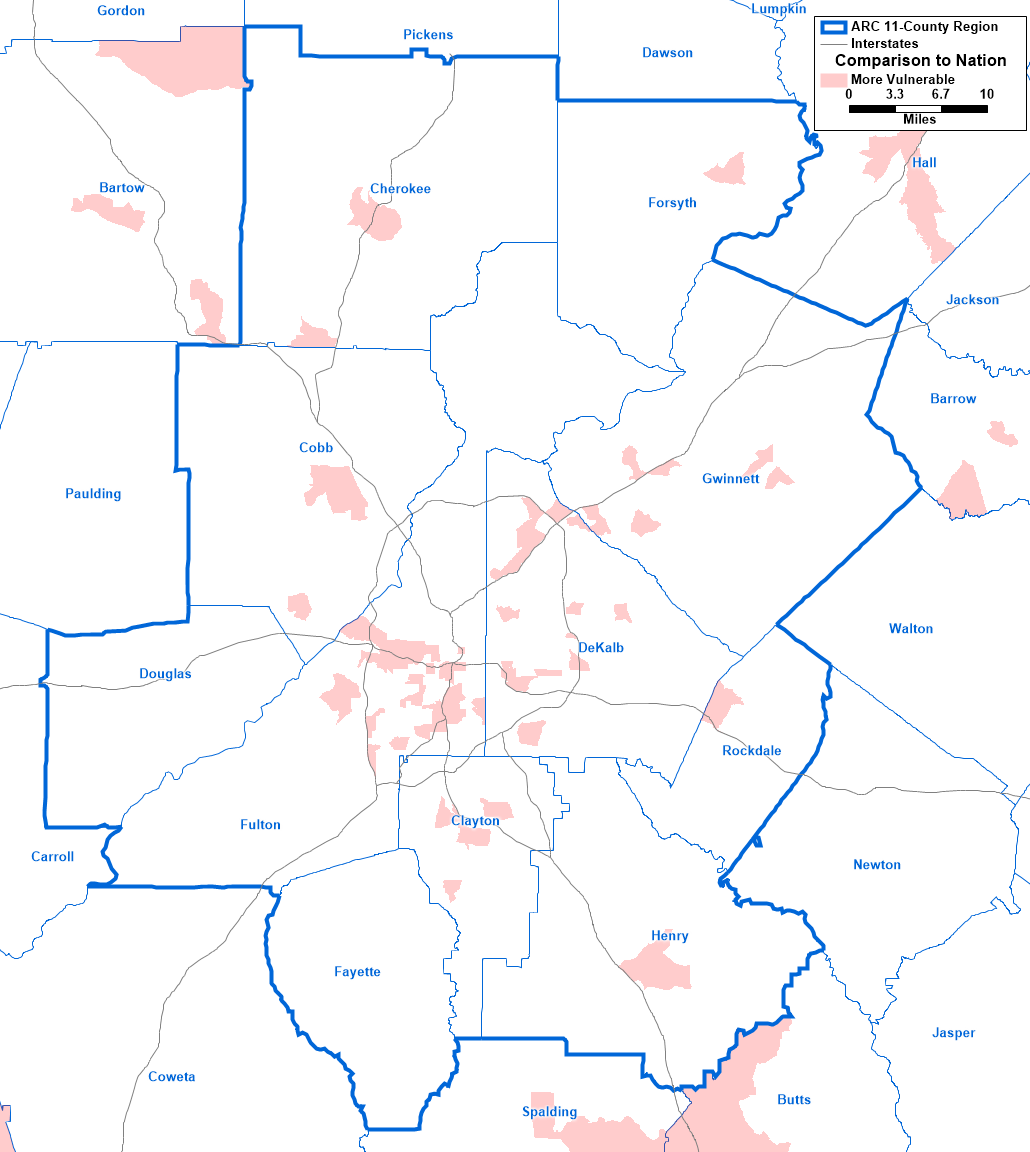
Zooming closer in to Census tracts in Figure 2 below, we do see that nine of the 11 ARC counties have at least one small geographic area that is more socially vulnerable than the nationwide tract- level average, the two exceptions being Fayette and Douglas counties.
Figure 2: CRE for Heat: Census Tract to Nation Comparisons (Source: Census Bureau CRE for Heat, ARC Research & Analytics)

This index can help municipalities and nonprofits prepare ways to protect vulnerable populations in advance of extreme heat events. But at the same time, recognize that such moves are only a band-aid. We also need to take steps to prevent extreme temperatures events such as reducing urban heat islands by protecting our tree canopy, embracing sustainable forms of energy and commuting, and reducing waste.

