You must have felt it. Back in June 15th, 2022 – an excessive heat warning was issued in Georgia, with temperatures feeling like 105 in metro Atlanta, and 115 in East Georgia Atlanta’s temperature for that day reached a 70-year record high, with a scorching 99 degrees Fahrenheit (Prince, 2022). Atlanta’s temperatures have risen, alongside the rest of the country, at an average rate of 3.3 degrees Fahrenheit per year (Wheatley, 2012), and additionally Georgia currently averages about 20 dangerous heat days a year. In Atlanta’s case, that comes out to about ~90 degrees Fahrenheit.
Why is it so hot these days? A lot of factors, but it mostly boils down to human-accelerated climate change. Many economies’ current modes of production and consumption cause what everyone has heard by now: more greenhouse gases, and more greenhouse gases trap heat. Knowing the “why”, and that the result is that temperatures will continue to rise for the foreseeable future, we can ask: how does this heat differ from heat in the past, what is it going to look like in the future, and who does this affect the most?
Historical Heat Trend
The most direct method by which we can look at heat trends is temperature observation[1]. Atlanta’s temperatures have been recorded for decades, so we can see how heat has changed over time.
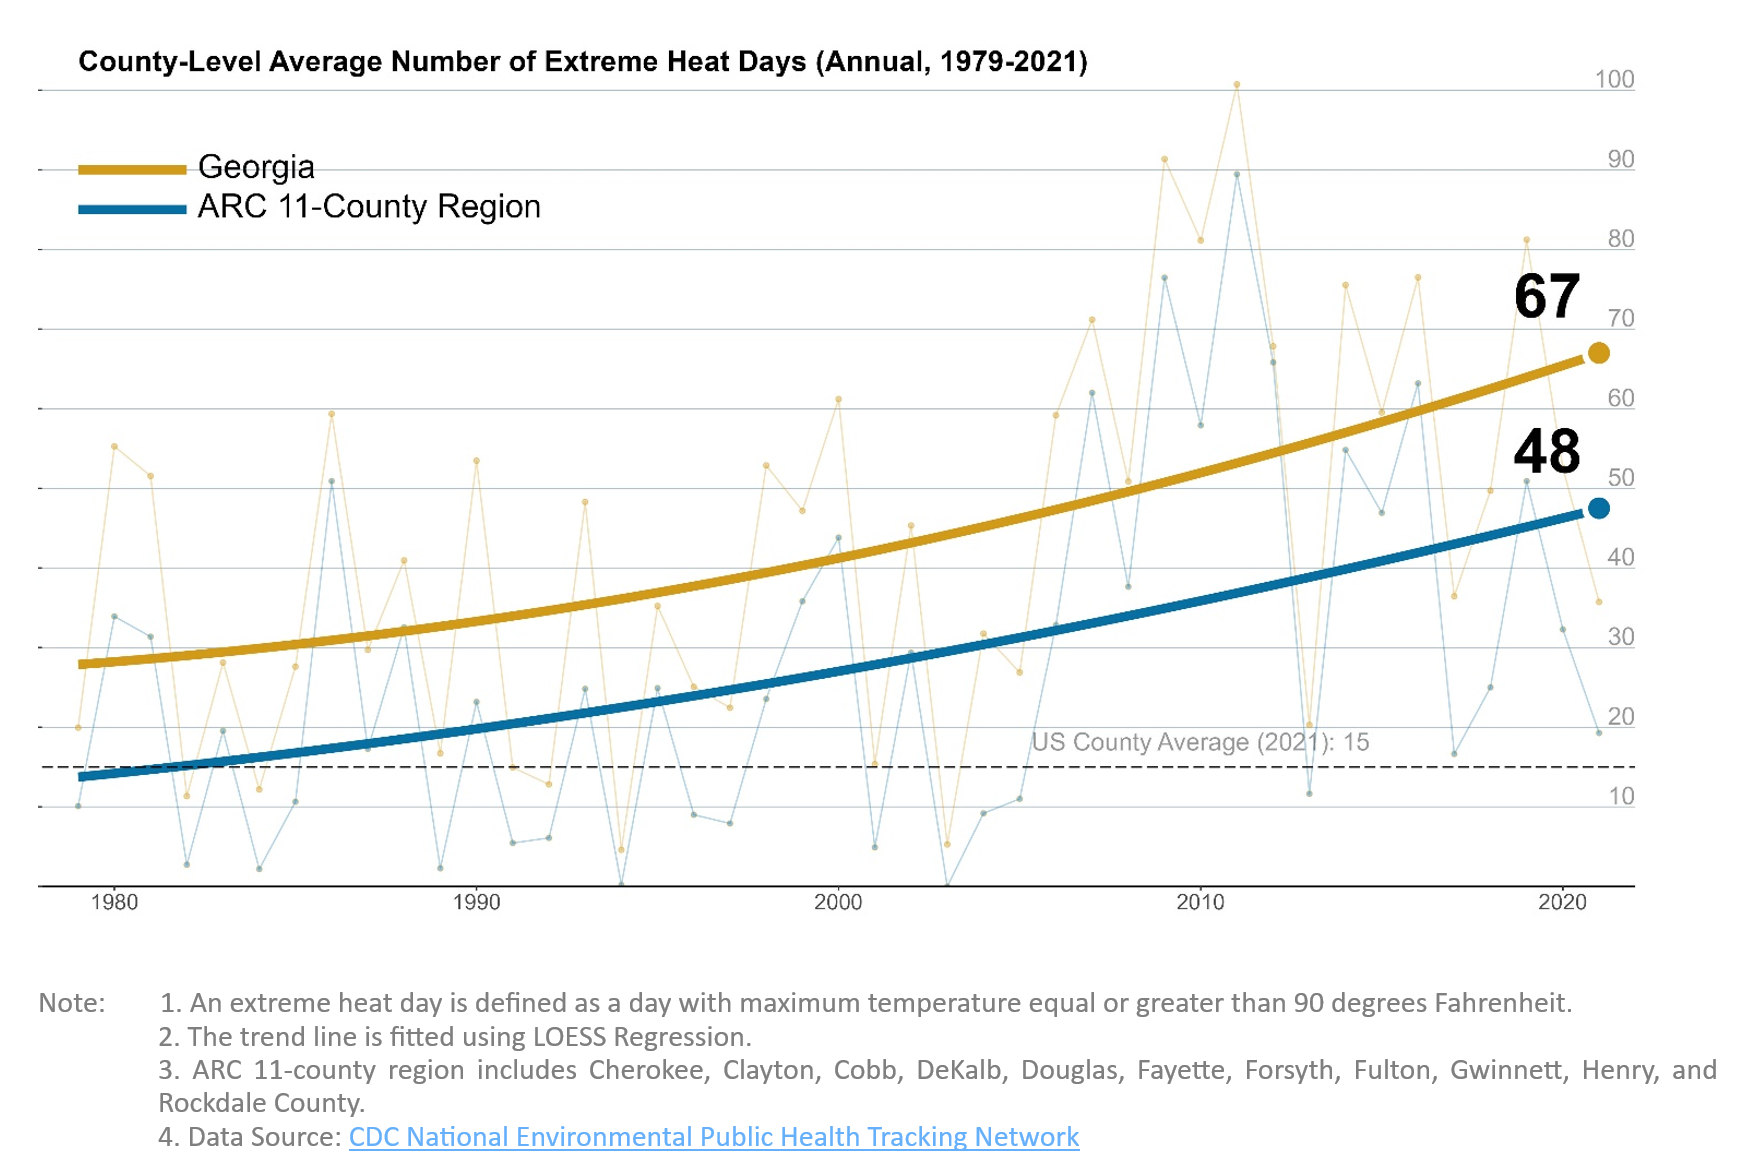
Extreme heat events are periods of high heat and humidity with temperatures above 90 degrees (extreme heat days) for at least two to three days. By this definition, the line chart in Figure 1 illustrates the long-term upward trends in the frequency of annual extreme heat days over the last four decades from a statewide and regional (Georgia and 11-county ARC region) perspective. Despite some level of variance, both the 11-county region and Georgia have experienced a substantial rise in the occurrence of extreme weather days at the county level. Notably, the most recent peak occurred in 2011, during which an average of over 100 extreme heat days were recorded across all counties in Georgia. In contrast, the number has never exceeded 60 in any year over the period of 1980 to 2010.
To help better isolate the trend under the variance, a LOESS (locally estimated scatterplot smoothing) regression[2] was employed on two time series that depict the average number of extreme heat days (represented by the orange and blue lines). The results show the statewide average number of county-level extreme heat days has doubled from less than 30 in 1980 to 67 in 2021. ARC counties have experienced an even sharper increase, rising from 15 days in 1980 to 48 days in 2021.
Figure 1. Trends in County-level Extreme Heat Days from 1979 to 2021 (Source: CDC National Environmental Public Health Tracking Network)

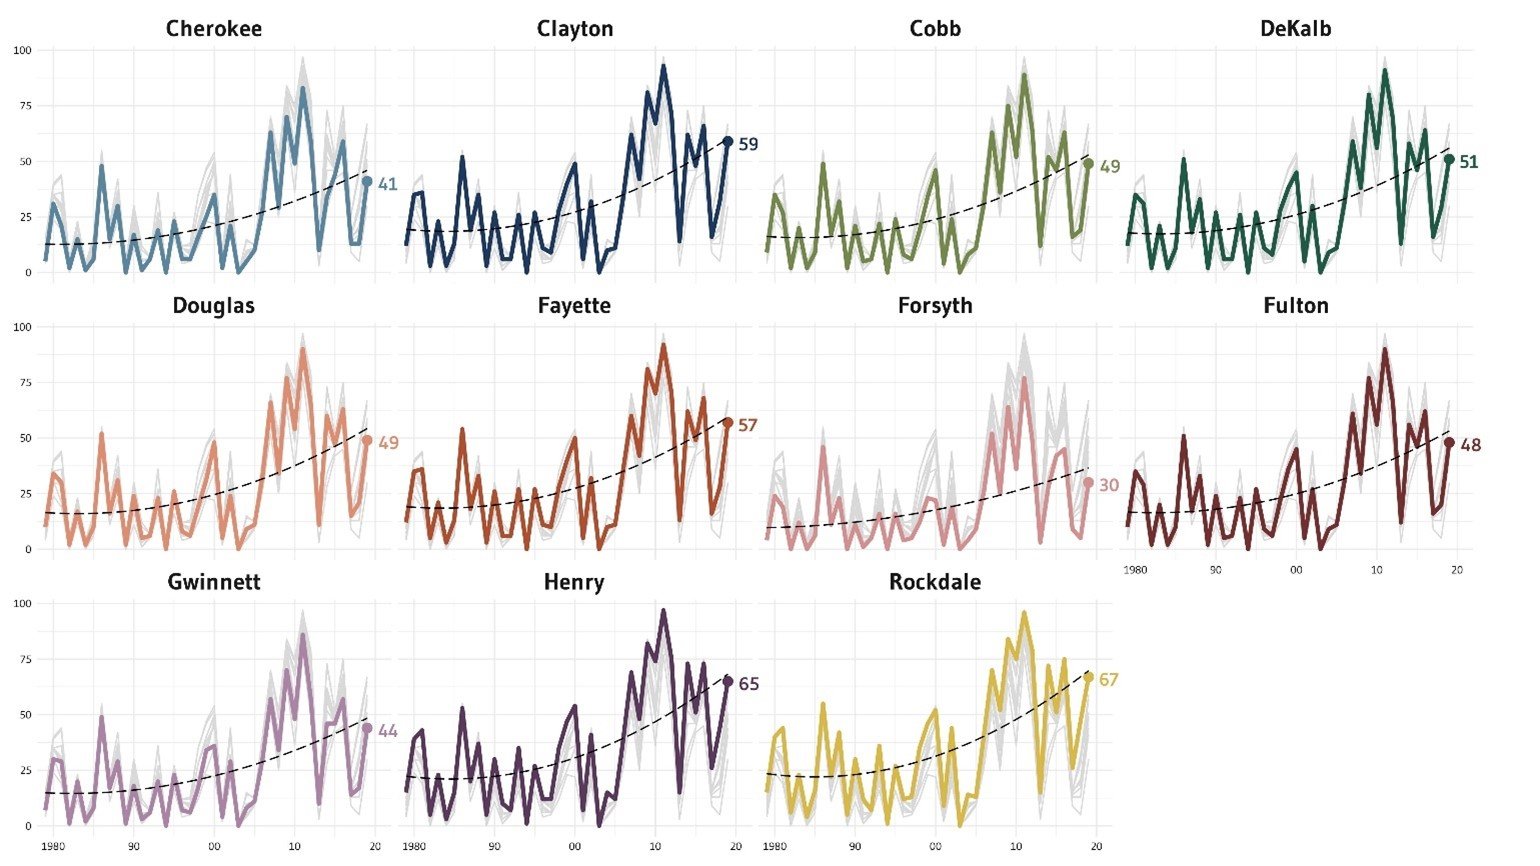
Geographically, changes in extreme heat days among counties within the ARC region also vary. Figure 2 (below) indicates that county “leaders” in recent increases of heat days include Henry (25 to 65), Rockdale (25 to 67), DeKalb (20 to 51) and Henry (25 to 65). In comparison, Forsyth and Cherokee have experienced a relatively moderate increase. In addition, the LOESS curve (long dashed line) for each county provides further insight into the pattern of an accelerating rate (e.g. the slope of the curve) of extreme heat days over the last two decades.
Figure 2. ARC Counties’ Extreme Heat Days Trend from 1979 to 2021 (Source: CDC National Environmental Public Health Tracking Network)

During the last month assessed (05/16-06/14), there were more than 30 million people in the US under active National Weather Service extreme heat advisories, watches, and warnings. The cost of excessive temperatures can be immense. Research efforts have well established that high ambient temperatures can cause negative health effects such as heat cramps, heat exhaustion, heat syncope, and heat stroke. More importantly, communities all have vulnerable populations that will be especially susceptible to heat-related illness. Knowing and evaluating historical heat trends are one way for local communities to better prepare for and respond to extreme heat events. In Episode 2 of this Summer Series, we will be looking toward the future: analyzing heat projections for Atlanta and Georgia!
[1] In this analysis, we use the county-aggregated gridded estimates of air temperature (K) at 2 meters above the surface from the North American Land Data Assimilation System (NLDAS-2). Raw data was cleaned and published by CDC National Environmental Public Tracking Network.
[2] LOESS is a method to analyze and visualize relationships between variables. It’s especially useful for data that varies a lot due to a lot of factors – like temperature.
References
Prince, C. (2022, June 15). Atlanta breaks record as temps hover near 100 degrees. AJC
Wheatley , T. (2012, June 12). Atlanta’s summers are getting hotter. Axios Atlanta.

