
Digesting Census data analysis, and evaluating news that cites Census data for that matter, is going to involve some “need to know” on census geography. These geographies are the spatial units for which the Census data variables are reported (or alternatively, the areas into which aggregations of individual person and household data “go”). In the next few months on this blog, we will have a few posts that explore a few of the available geographies that tend to be most commonly used in the studies or the findings you see mentioned in the press media…or on LinkedIn…or even on Facebook (way more rarely, for sure). We start with the Census block, the very smallest unit of geography for which the Bureau publishes their data for the decennial census.
We typically think about a block in terms of the physical street. If you ask someone where they live, they might respond with something like, “the 1000 block of Virginia Avenue” which also happens to be the city block shown here in Figure 1:
Figure 1: Example City Block
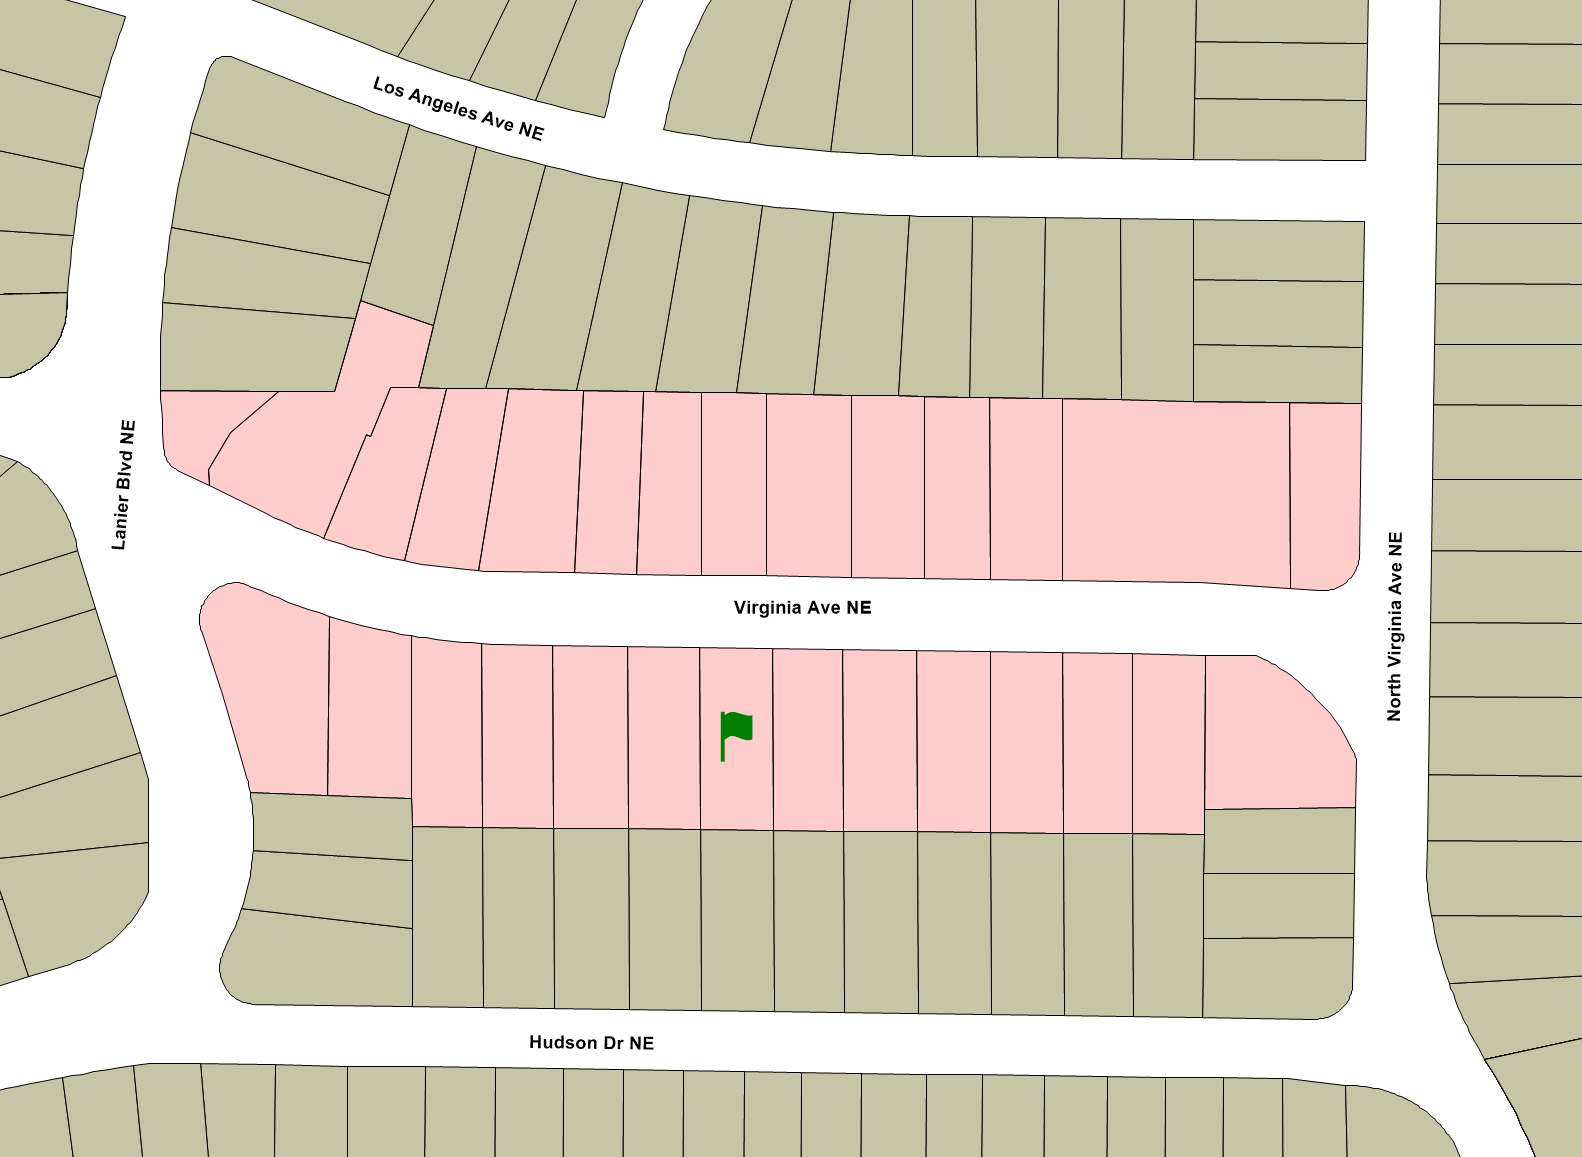
If you lived, for example, in the house marked with the green flag, you would probably consider everyone on both sides of your street as living on your block, i.e., all of the parcels marked in red. But the Census Bureau has a very different understanding of your block. Your Census block excludes some people you would consider to be close neighbors: the house directly across the street with the blue flag, for example. And it would include some whom you wouldn’t consider to be close neighbors: every parcel marked in green would be in the same Census block as the house with the green flag, while the blue parcels would form the Census block belonging to the blue flag, as shown in Figure 2:
Figure 2: Example Census Blocks
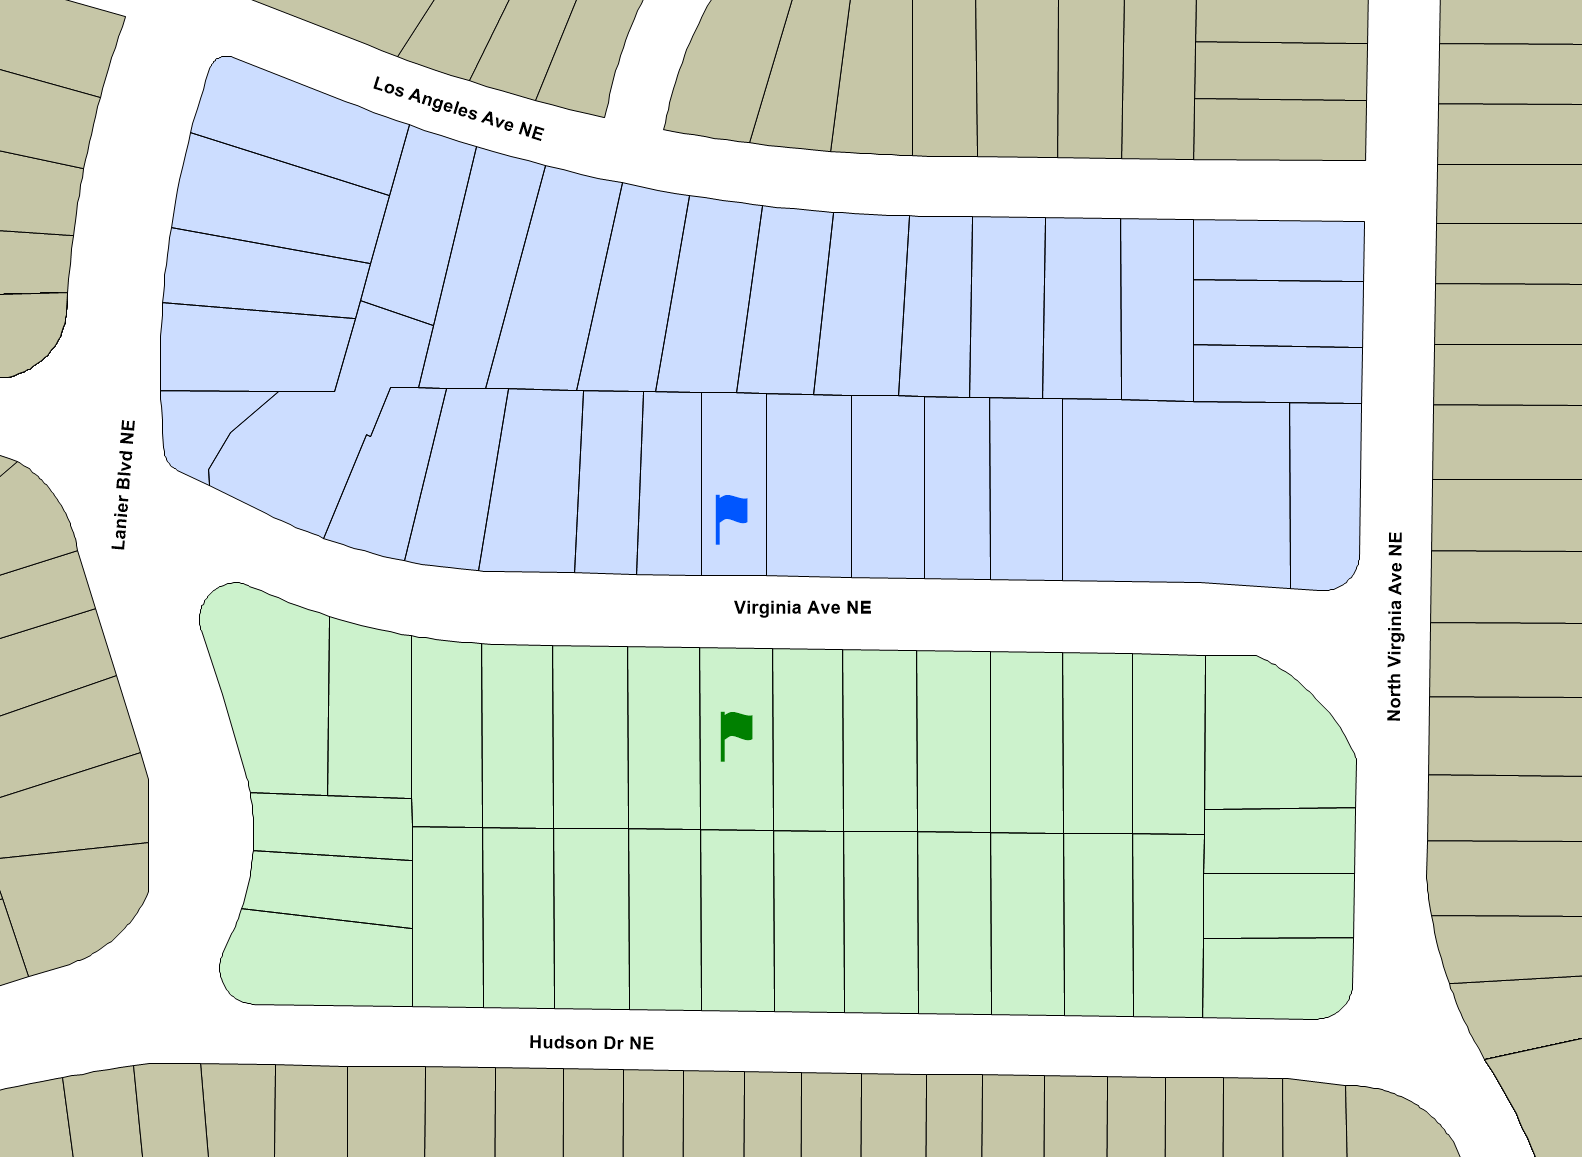
Another way to think of it is as follows: if you take your dog for a walk around the block without crossing the street, all of the sidewalks you walk belong to the houses in your Census block.
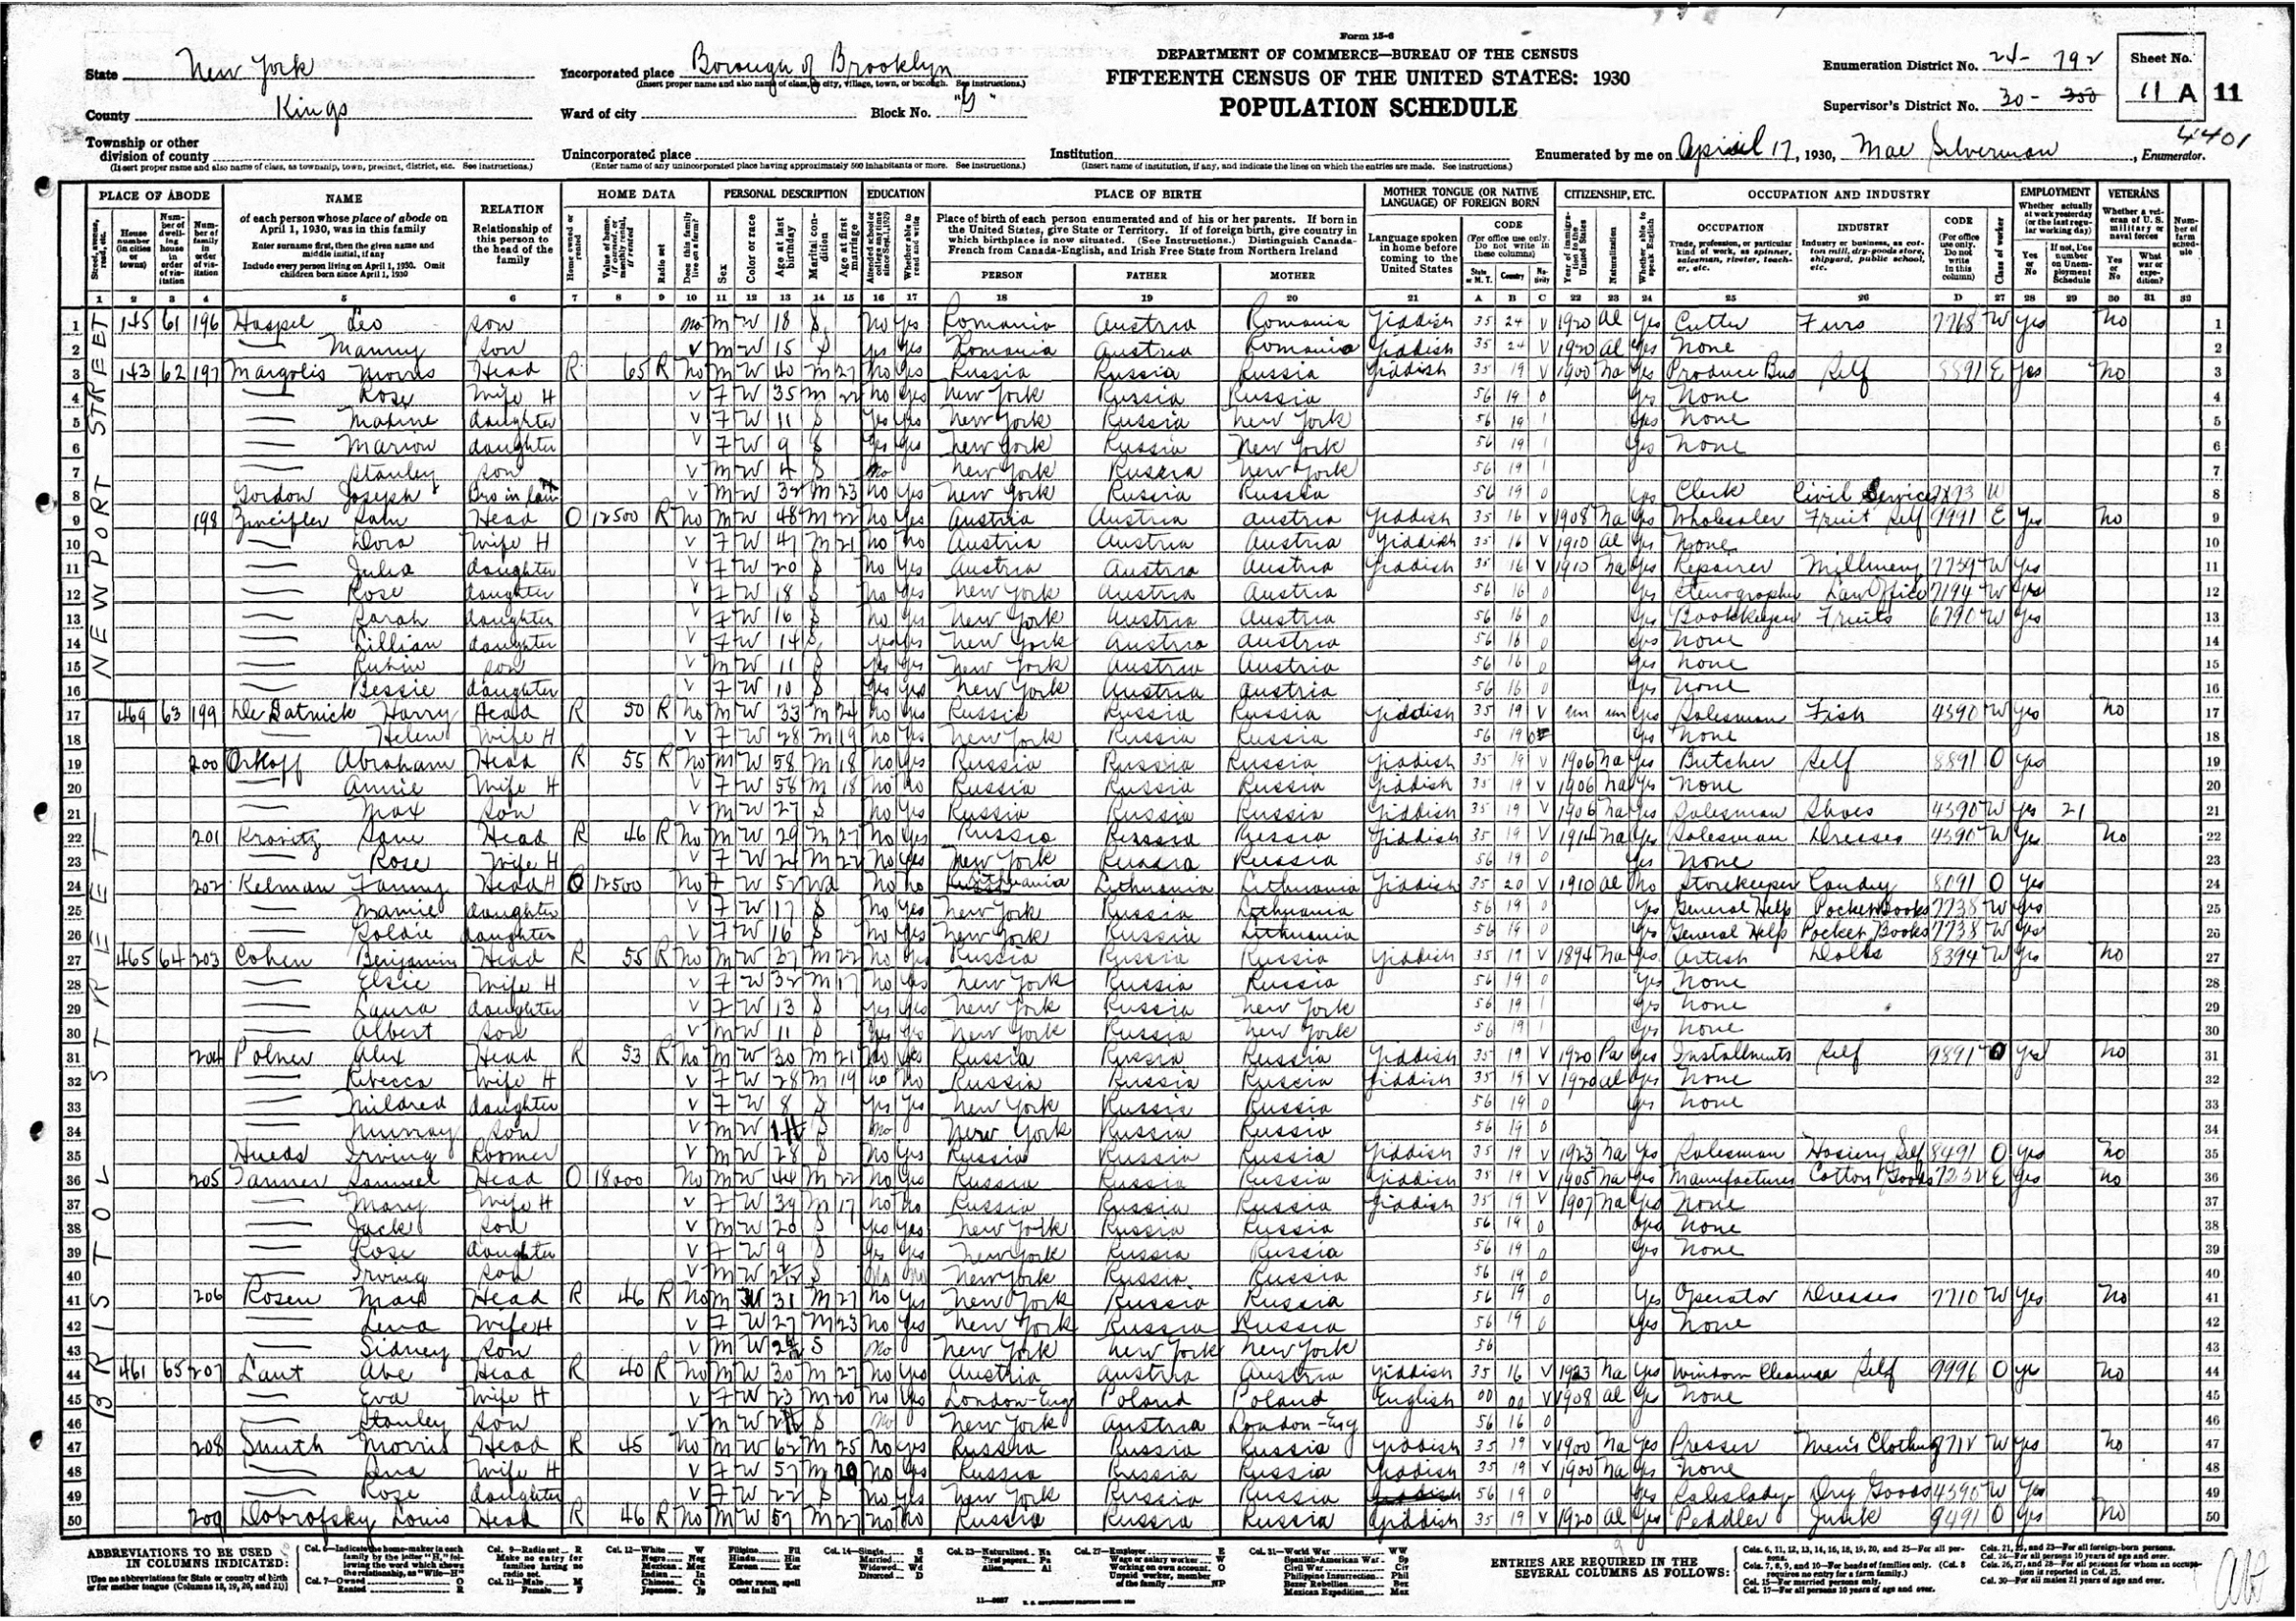
It may seem odd that the Census Bureau defines blocks differently than you or I typically think about them, until you consider how they came about. Not that long ago, most Census data was collected by “enumerators” who administered the Census questions face-to-face. These enumerators were instructed to walk around an entire block without crossing the street because reduced the likelihood of missed houses or any double-counting. They then wrote the responses down on large forms[1] like this one from 1930 (featuring my grandfather in line 1 shortly after he came through Ellis Island):
Figure 3: Sample Population Schedule, 1930 Census
A second reason why blocks are drawn this way is to help with their ultimate purpose. The Census Bureau needs to be able to report data for small geographic units that can be easily described with (reasonably) permanent visible features– most commonly streets, but when those are unavailable, streams, rivers, or even powerlines and pipelines will do. The only exception is that blocks split at the city limits even if there isn’t any visible feature.[2]
The Census Bureau then uses these as the building blocks for all other geographies: blocks nest into block groups, which nest into tracts, which nest into counties (or county equivalents such as parishes in Louisiana or territories in Alaska), which nest in turn into states (or state equivalents such as Puerto Rico or the District of Columbia). Other sorts of geographic units such as cities do not fit cleanly into this hierarchy: the city of Atlanta, for instance is part in Fulton County, and part in DeKalb. Similarly, metropolitan areas can include counties from more than one state. But all of these geographies can be described perfectly in terms of a set of Census blocks.
The Decennial Census data tabulated to the block level is used to draw Congressional and state legislative districts. Again, these can span multiple tracts, cities, or even counties, but they are always collections of Census blocks.
Nerd Alert: Every Census block in the U.S. can be uniquely identified by a 15-digit code. The first two digits tell you the state. The numbers are assigned in alphabetical order; Georgia is 13. The next three digits denote the county within the state, again assigned in numerical order. For example, DeKalb is 089, while Fulton is 121. The next six digits identify the Census tract[3], while the final four identify the block within the tract. The first digit of that final four grouping has a special meaning: it indicates the block group number for that particular block.
Footnotes:
[1] The 1930 enumeration form measured 23¾” x 16½” (!).
[2] For more about the criteria for Census blocks, see Chapter 11 of the Census Bureau’s Geographic Areas Reference Manual.
[3] See our previous post about Census tracts: https://33n.atlantaregional.com/mapday/tracking-census-tracts