Monday Mapday: Demand for Exercise Products / Services

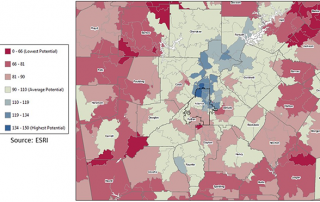
This map shows the market potential for exercise products/services based on the number of adults who follow a regular routine. The areas in tan represent an average demand (compared to national demand). The red areas represent lower demand, and the blue areas represent the greatest demand, indicating the highest market potential.

By |2016-12-08T15:25:28-05:00November 2nd, 2015|Monday Mapday, Public Health|0 Comments

Regional Snapshot: Public Health in Metro Atlanta

Map 1: Years of Potential Life Lost Before the Age of 75 (YPLL75) 2011-2013 (YPLL75 is a commonly used measure of premature death. We’ll talk more about YPLL75 later on the post.) Blues represent the “unhealthiest” counties, while yellows represent the “healthiest” counties. For May’s Regional Snapshot, we looked at the state of public health [...]

By |2016-12-08T15:25:32-05:00May 14th, 2015|Public Health, Regional Snapshot|0 Comments
Go to Top