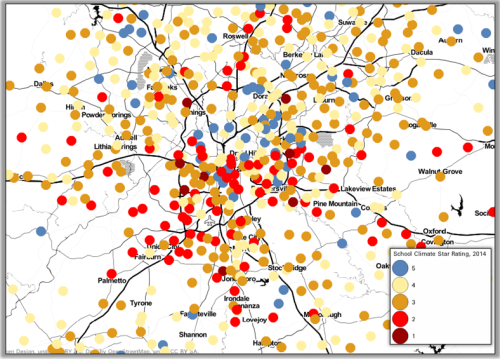
In an effort to holistically assess schools’ environments in Georgia, the Georgia Department of Education (DOE) has released the 2014 School Climate Star Ratings. This inaugural system is based on surveys distributed to all schools in the state and reflects the “culture”, character and quality of school life. These assessments are particularly important because a school’s climate is crucial for the well-being, development,and success of its students. They can also determine which schools need the most assistance in creating more productive environments. The thinking goes that a safe and supportive school environment fosters better learners. Thus, school climates are a contributing factor to student achievement.
Climate Rating by School- On a scale of 1 to 5 (5 being best)

These new ratings incorporate disciplinary data, attendance, student perceptions of safety gleaned from a survey. Specifically the rating system developed by the DOE provides school level data on the following components:
- School Climate- a measure of student, teacher, and parent perceptions of a school’s climate and the congruency between the three.
- Student Discipline- a look into disciplinary practices and utilization of the research- based practices promoting positive interventions.
- Safe and Substance–Free Learning Environment-student responses on use of illegal substances and the prevalence of violence, bullying, and unsafe incidents within a school.
- Attendance– the average daily attendance of students, teachers, administrators, and staff members.
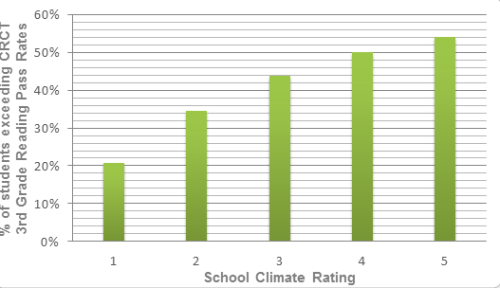
So, to kick off our new blog, we wanted to analyze this rating system to determine if the Climate Ratings scores are actually reflective of student achievement. To do this, we isolated each school by its Star Climate rating, i.e. we isolated all elementary schools with a “5” rating, all the schools with a “4” rating, and so on. For each grouping, we then compared the percent of students who exceeded the CRCT (Criterion Referenced Competency Test) 3rd Grade Reading pass rates.
Our preliminary findings indicate that Climate ratings align pretty well with exceed rates, despite some of the initial misgivings about the measure (more on that in a bit). The chart below illustrates a clear and consistent trend – the schools that earned a “5”climate rating had the highest exceed rates. Further, as the climate scores go down, so do the exceed rates on CRCT. For instance, 54 percent of students exceed test pass rates in schools with ratings of 5 while only 20 percent of students exceeded the 3rd grade reading standard in schools with ratings of 1.
School Climate Ratings According CRCT 3rd Grade Reading Pass Rates

Now the usual caveats apply. For this analysis, we just looked at 3rd grade reading, while the school climate ratings assess the entire school. And, remember, this is the first time DOE has released these data. Additional tweaking might be in order. In fact, on the day they were released, concerns over the ratings’ accuracy were published in a popular education blog by Maureen Downey. In her Get Schooled blog post, Ms. Downey wondered why high achieving schools can have unsatisfactory ratings, while Alternative schools with low student attendance can have the highest possible rating. She explains “after looking at my district, Decatur City Schools, and DeKalb, it’s hard to reconcile some of the ratings” when “Decatur’s 4th and 5th grade academy- Fifth Avenue Elementary- earned only two stars” while having “strong academic ratings on the state’s 100 point scale College and Career Ready Performance Index”.
While we are not ready to declare that DOE created the perfect measure of school environment, based on our preliminary analysis, we can see a clear correlation between climate ratings and student achievement. We can also agree that a school’s healthy “culture” plays a crucial role in the performance of its students.
Play around with these data – and A LOT more – on Neighborhood Nexus’ statewide education data visualization suite. We included a whole bunch of school level indicators, including the School Climate Star Rating data. To find it, click on the title in the color legend, then open up the “College and Career Readiness Index” folder. The ratings are in this folder.

