
In light of shifting demographics, economic disparities, and notions related to identity, rural/urban comparisons have become a commonly-used lens for making sense of complicated issues facing our state and country. However, despite the widespread use of this lens, the distinction between “urban” and “rural” is not always clear cut, especially when it comes to data.
Using census tract-level data and a simplified version of the Census Bureau’s definition* of “urban” and “rural”, we calculated the average rates of childhood poverty in Georgia between 2012-16 to be roughly the same for “urban” and “rural” areas, at 24.9% and 25.3% respectively.
In contrast, a recent article in the Atlanta Journal Constitution cites the Growing Up Rural in America report, which indicates that 33% of children in “rural” Georgia were living in poverty in 2016, compared to an estimated 21% of children living in poverty in “urban” areas. Our analysis –and the conclusions of that analysis–differ from the results of this report and other analyses because we use a different definition of “urban” and “rural”.
In the Growing Up Rural in America report, the distinction between “urban” and “rural” areas is made, at the county-level, based on whether a county falls within a metropolitan area** (urban) or not (rural). This distinction is based on the USDA’s Economic Research Services use of this definition (explained further here) when performing timely economic analyses for which county-level data is the most readily available source. However, the Atlanta-Sandy Springs-Roswell Metropolitan Statistical Area (MSA) includes 29 counties spanning from Pickens to Pike (north-to-south) and Carroll to Morgan (west-to-east), all of which are considered “urban” by this broad definition, and “urban” is not the most accurate categorization for much of the area falling within the MSA. The U.S. Census Bureau notes that when using its data, metro and non-metro should not be used as a proxy for urban and rural. The Bureau instead defines rural as any place outside of what they specify as “urbanized areas” or “urban clusters” as shown on the map below (check out this interactive story map for more info on the Census Bureau’s urban and rural definitions).
Urban/Rural Georgia

Map created by ARC Research & Analytics using 2016 U.S. Census Bureau TIGER shapefiles.
In light of the differing definitions of “urban” and “rural” even between federal agencies, it can be difficult to decide which definition to use. In the case of the Growing Up Rural in America report, the authors of the report made a trade-off between data availability and trying to be current. To understand this trade-off, it’s critical to know that the Census Bureau, the source of these childhood poverty data, only provides data for counties that have 65,000 or more people in its 1-year estimates***. In Georgia, only 36 of the 159 counties in Georgia meet that 65,000 population threshold. While not as current, 5-year estimates**** provide data at the block group level (a sub-unit of a census tract) across the entire state, for all counties.
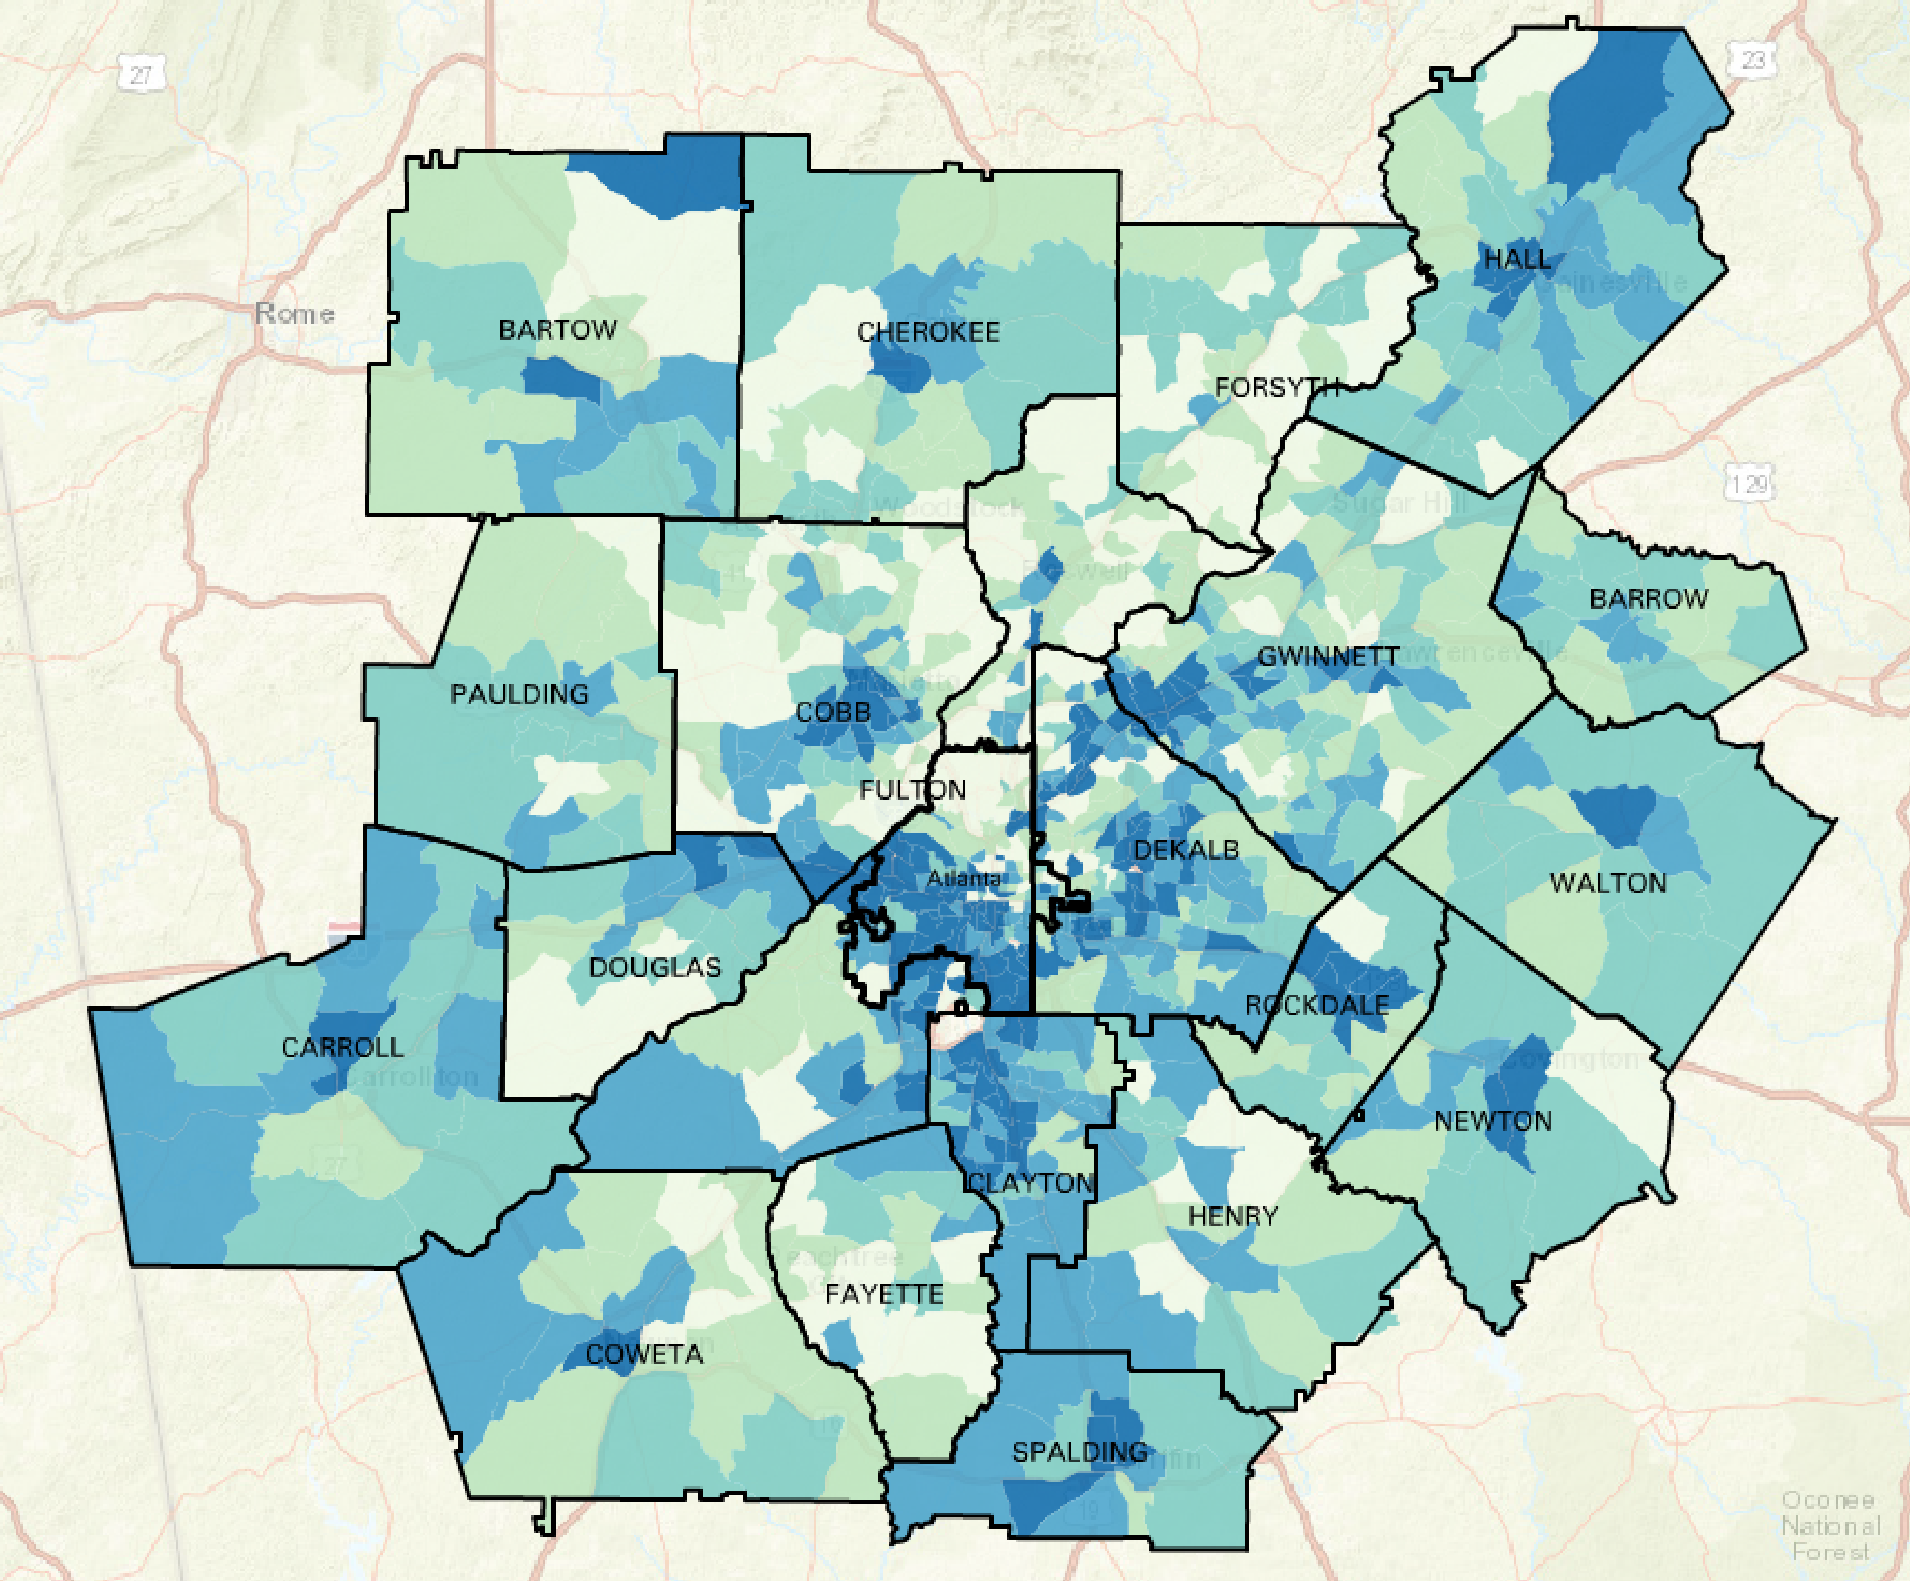
The maps below, using the 5-year estimates data, offer a glimpse of why this matters to the Atlanta Metro region in particular. The map on the first tab shows the percent of children in poverty by census tract within the 20-county ARC transportation and air quality planning area. The map on the second tab shows the percent of population under 18 years old by census tract for the same 20 counties. On the first map, one can clearly see a number of tracts in southwest Atlanta with more than 40% of the children living in poverty. On the second map, the pattern shifts to show the total under-18 population mostly concentrated outside of the city and in greater proportion in outer ring suburban counties. Looking at the children living in mostly “urban” poverty against the backdrop of markedly more-well-off suburban and rural areas of the Atlanta metro region may mask the significance of the “urban” childhood poverty problem.
Percent of Children Living in Poverty (2012-16 ACS)
by Census Tract in 20-county Atlanta Metro Region

Percent of Population under 18 years old (2012-16 ACS)
by Census Tract in 20-county Atlanta Metro Region


Maps were created using the Neighborhood Nexus mapping tool.
* Census tracts were classified based on whether their center is within (urban) or outside of (rural) an “urbanized area” or “urban cluster”
** Defined as metropolitan statistical areas (MSAs)
*** U.S. Census Bureau, American Community Survey (ACS), 1-year estimates, 2016
**** U.S. Census Bureau, American Community Survey (ACS), 5-year estimates, 2012-16