
The U.S. Census Bureau estimates that between July 1, 2024 and June 30, 2025, the U.S. population grew by 1.78 million people, or about 0.52%. By contrast, the United States added about 3.25 million– nearly twice as much– in the preceding year. While metropolitan areas[1] as a whole grew a bit faster (1.70 million, or 0.58%) than the nation and the 29-county Atlanta Metropolitan Statistical Area (MSA)[2] outpaced both (61,953 or 0.96%), growth was slower than in the prior year.
Changes in growth rates were sufficient to shake up the population rankings among the top 20 metro areas. Figure 1 depicts how they stack up.
Figure 1: Population for the 20 Largest Metros, July 2025
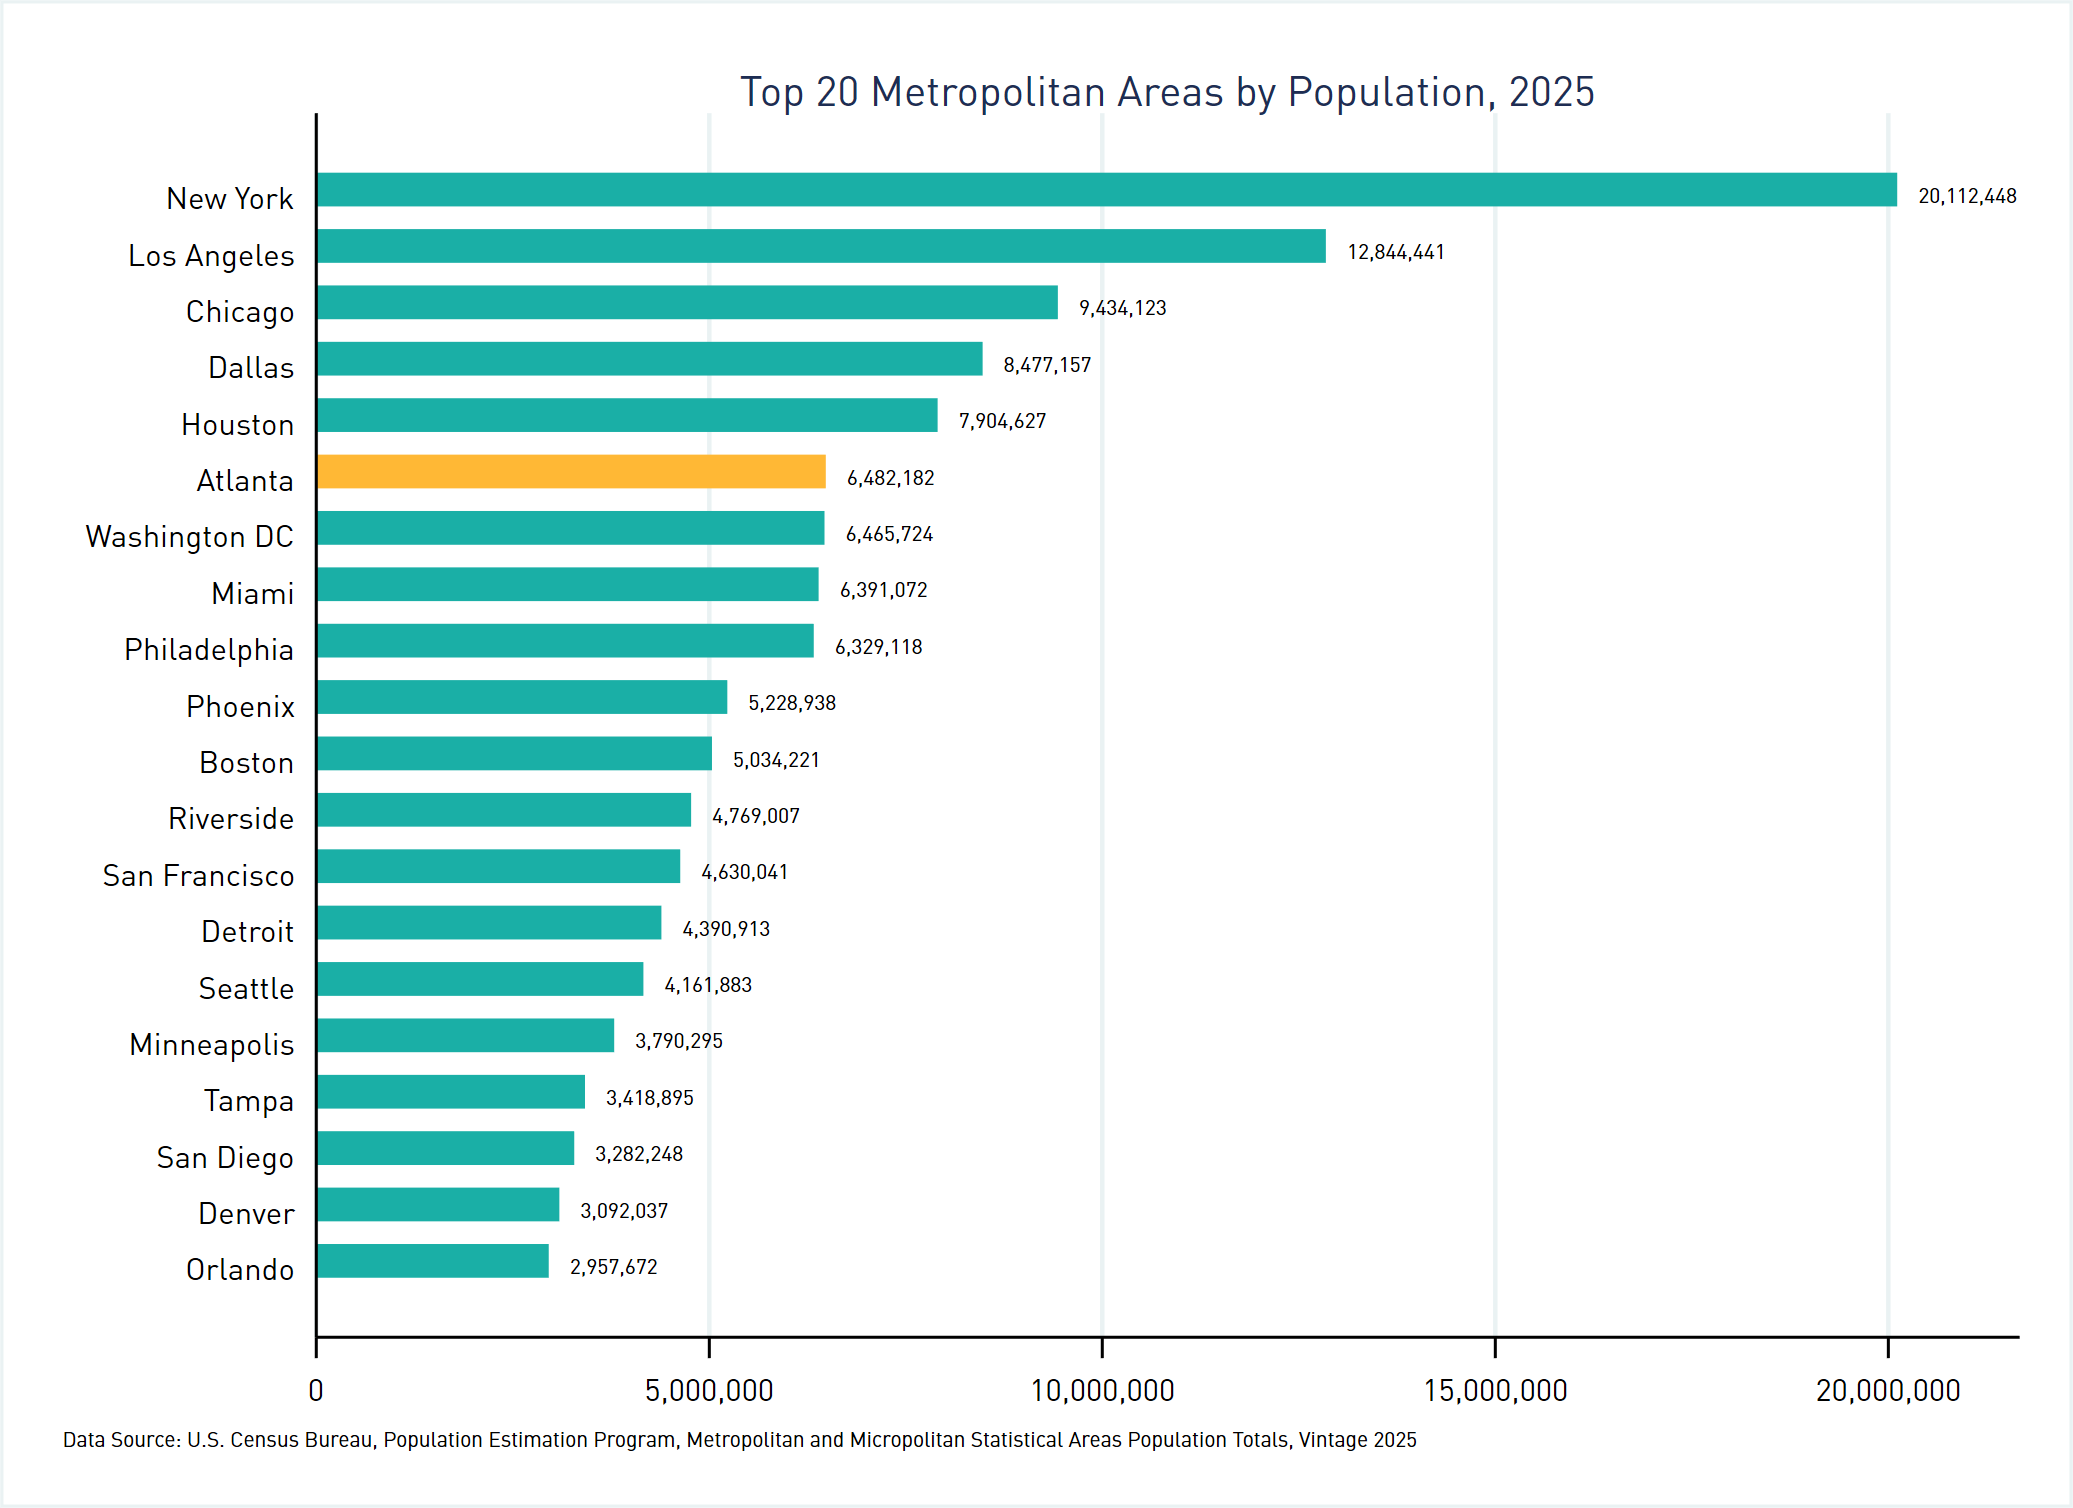
As this graph shows, New York, Los Angeles, Chicago, Dallas, and Houston are the top 5 metros by population for 2025. This ranking is the same as last year. But the next grouping gets interesting: the range between spots 6 through 9 is only about 153,000, close enough to see them swap places over time. And swap they did. Atlanta leapfrogged Washington DC and Miami to claim the #6 spot. And Miami, which had been ranked #6 last year, dropped to #8. The remaining metros retained their spots from last year.
Figure 2 shows population change between 2024 and 2025 for the top 20 metros.
Figure 2: Change in Population for the 20 Largest Metros, 2024-25
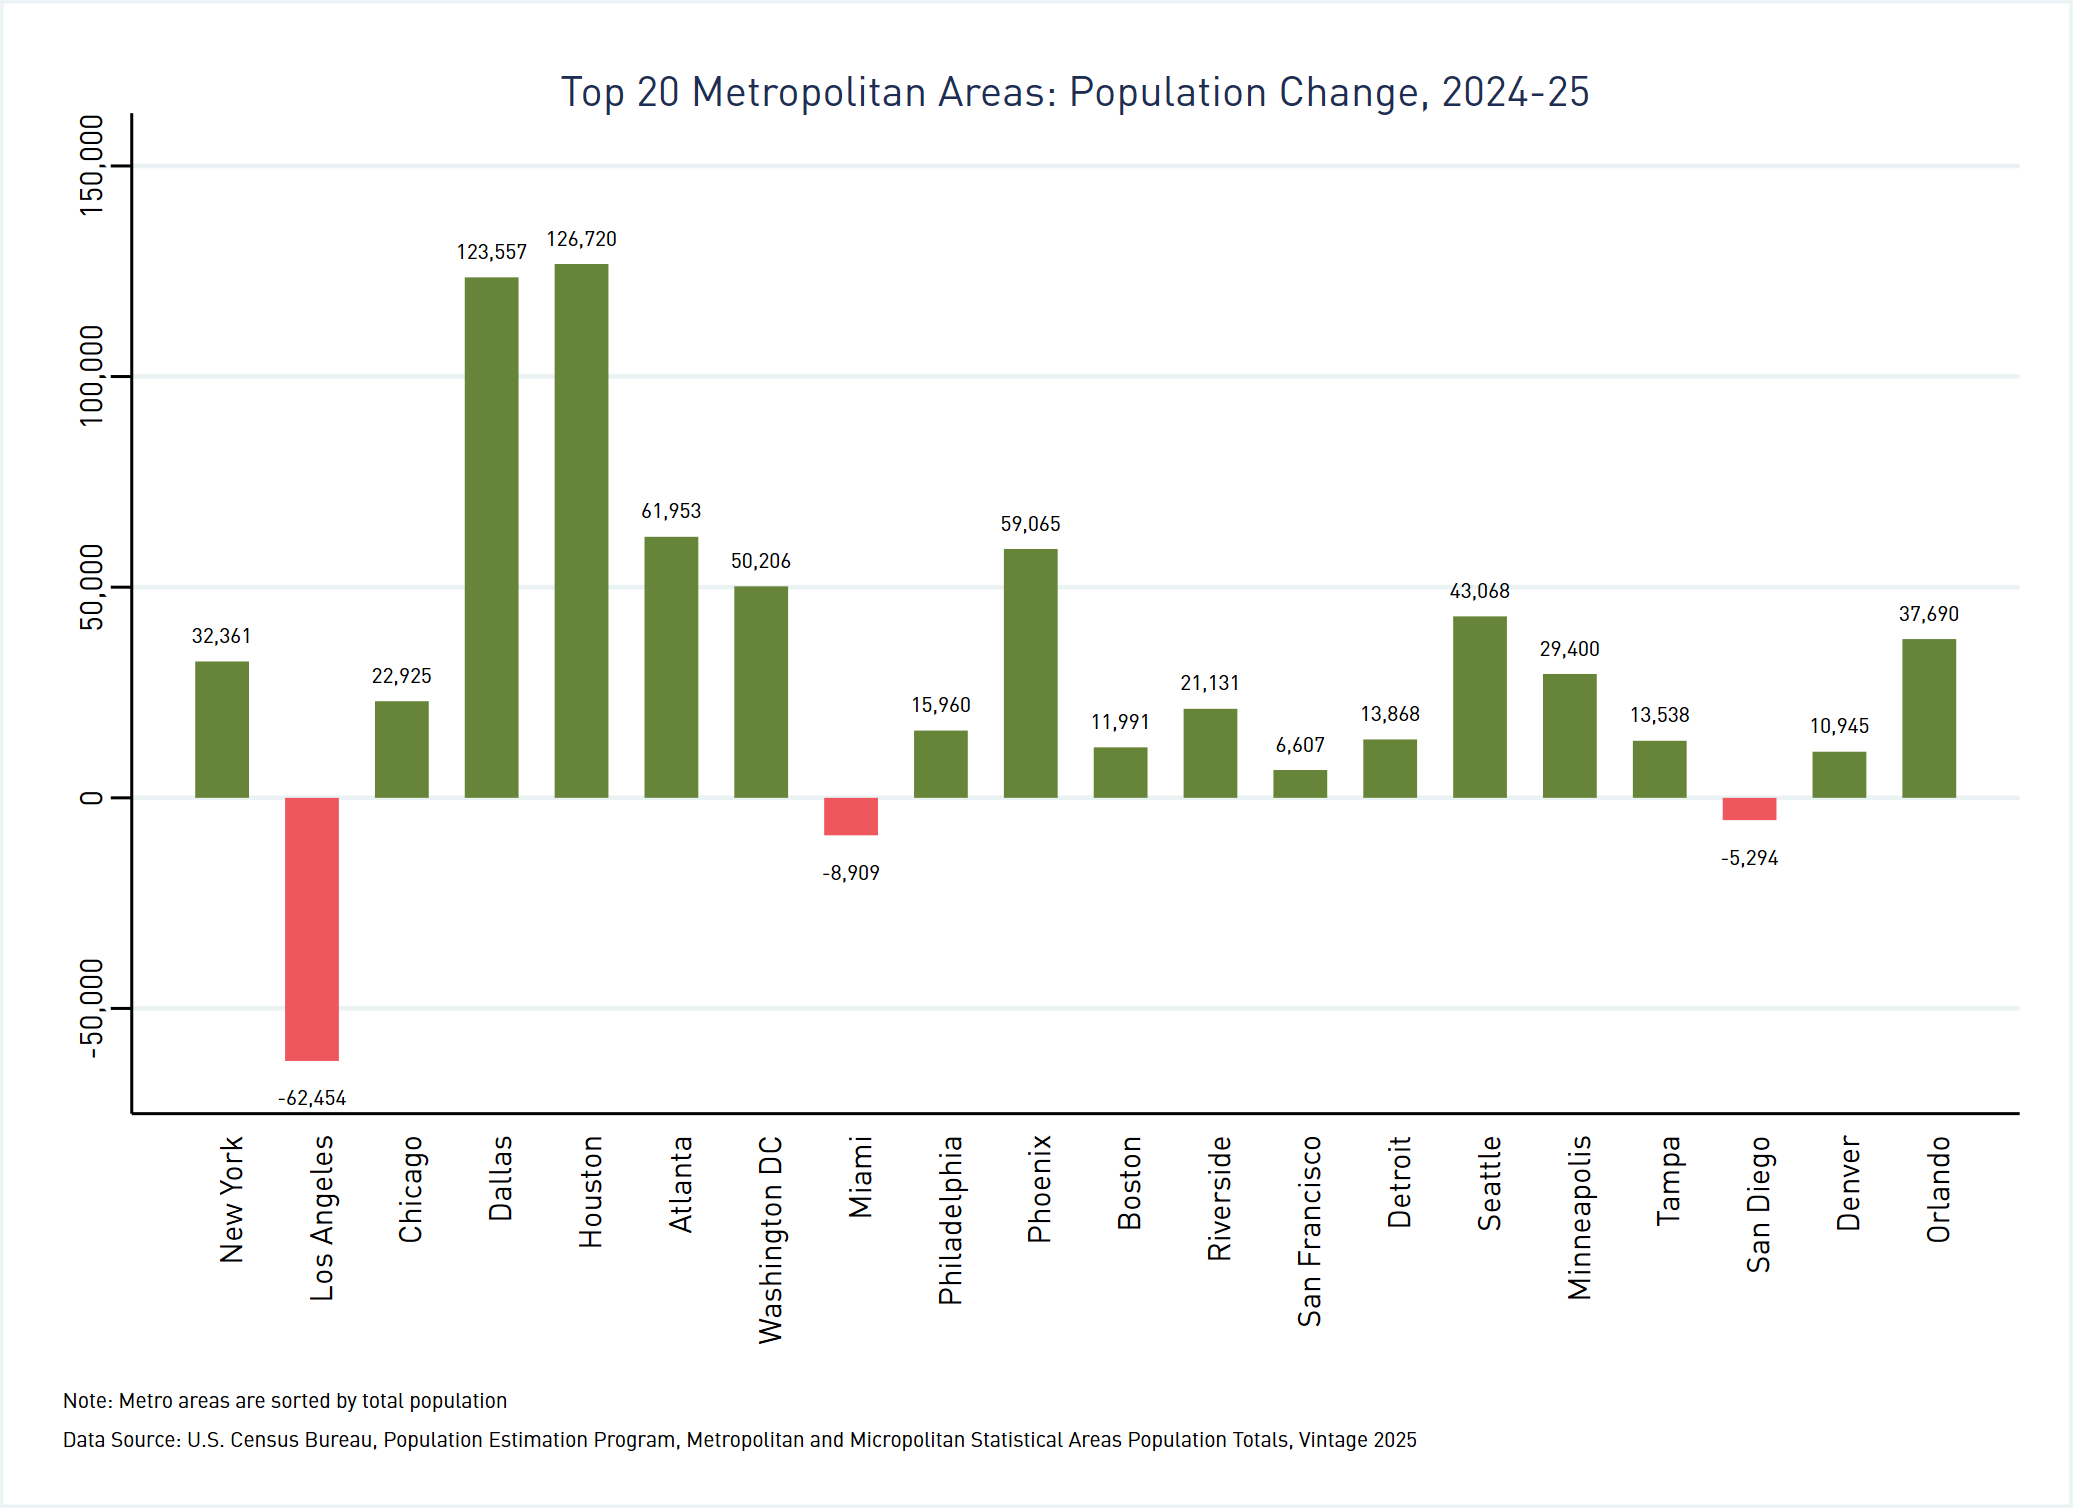
Dallas and Houston added the most residents among the top 20 metros. The Atlanta MSA had the third highest population growth, followed by Phoenix and Washington, DC. At the other end of the spectrum, San Diego, Miami, and Los Angeles all lost population year-over-year.
It would be hasty to fixate on just one year’s data, however. Figure 3 takes a 5-year time horizon, extending from July 1, 2020 to July 1, 2025.
Figure 3: Change in Population for the 20 Largest Metros, 2020-25
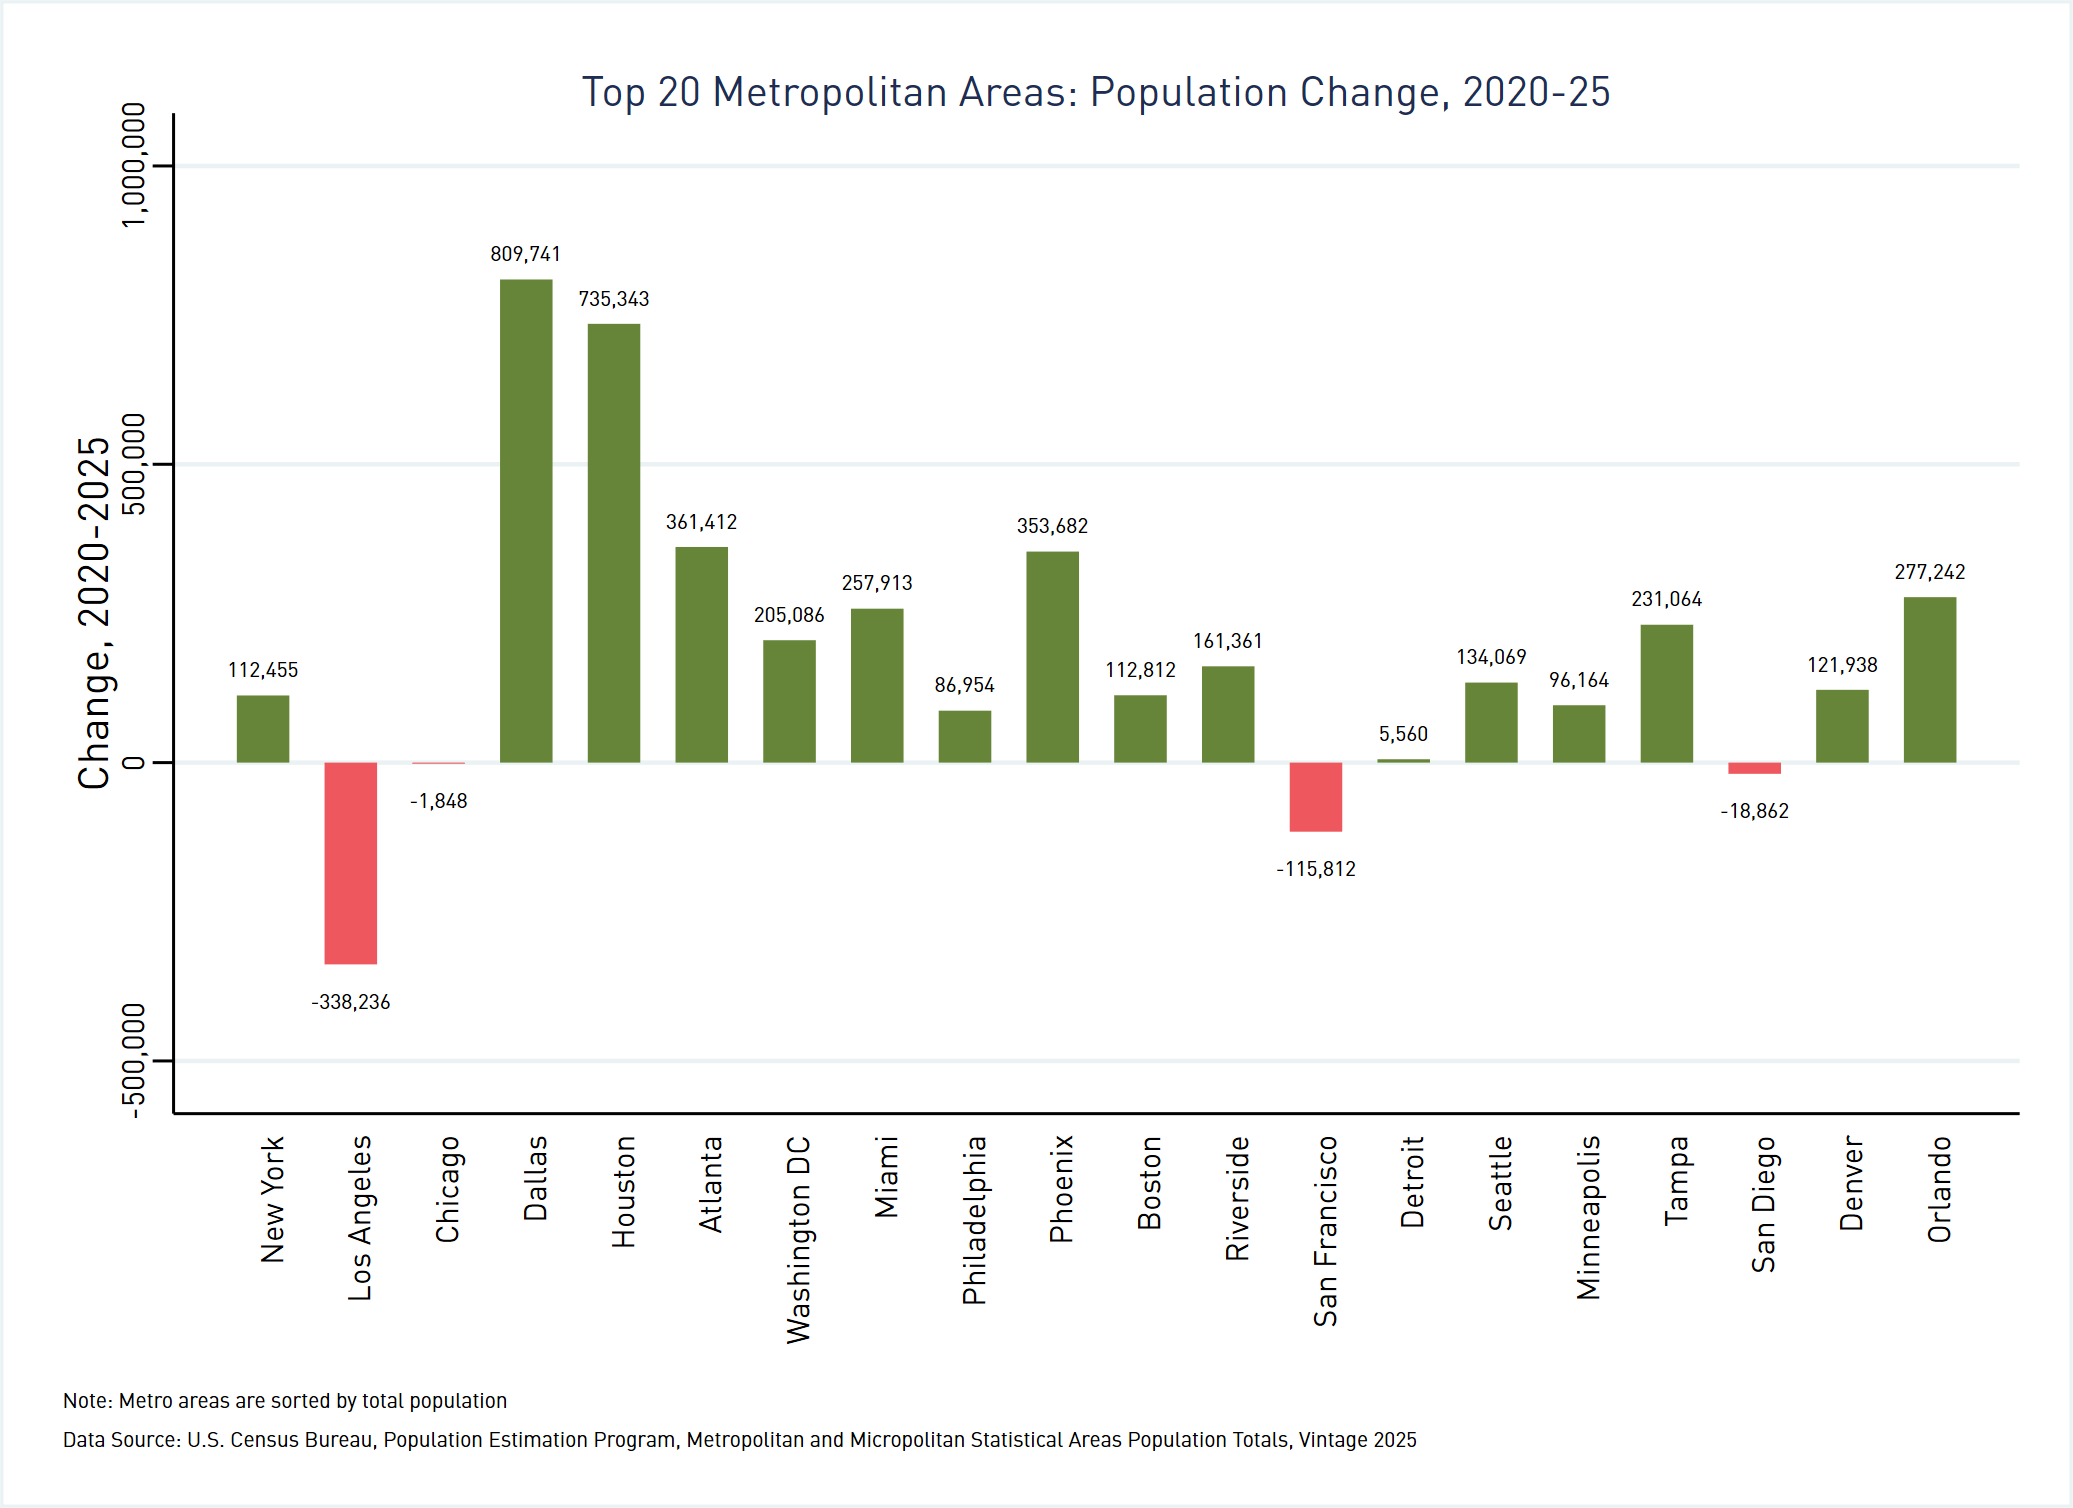
We see that Dallas and Houston posted impressive growth over the last half-decade, not just year-over-year. If Dallas’s population growth were its own metro area, it would rank 78th among all metros, just ahead of Greensboro, NC. Houston’s population growth during this period was greater than the current population of metropolitan Kiryas Joel-Poughkeepsie-Newburgh, NY, which would put it as the 84th largest metro. Atlanta’s growth was just larger than the current population of metro Gainesville, FL and Phoenix grew about as much as the total population of metro Lincoln, NE. Chicago and San Diego lost small populations, roughly net zero. Though San Francisco made up some of its lost ground last year by gaining 6,607 residents, since 2020 it shed about the same number of people as currently live in the Anniston-Oxford, AL metro area. And Los Angeles lost more residents than the current population of the Green Bay, WI metro over the last five years.
What explains the patterns of population change among these metros? In a future post, we’ll dig into change by component.
Notes:
[1] Metropolitan Statistical Areas (MSAs) are groups of counties delineated by the Office of Management and Budget on the basis of social and economic integration. This integration is measured by commuting patterns, so they are essentially labor markets. An MSA needs to have at least one urban area of minimum 50,000 population. Similarly integrated areas with smaller urban areas (between 10,000 and 49,999 population) are called Micropolitan Statistical Areas (µSAs). The term Core-Based Statistical Areas (CBSAs) is used to refer to MSAs and µSAs collectively.
[2] Technically, the Atlanta MSA is called the Atlanta-Sandy Springs-Roswell, GA Metropolitan Statistical Area, in recognition of the fact that our region has multiple urban cores.
Follow this link to download the data behind the graphs in the post.