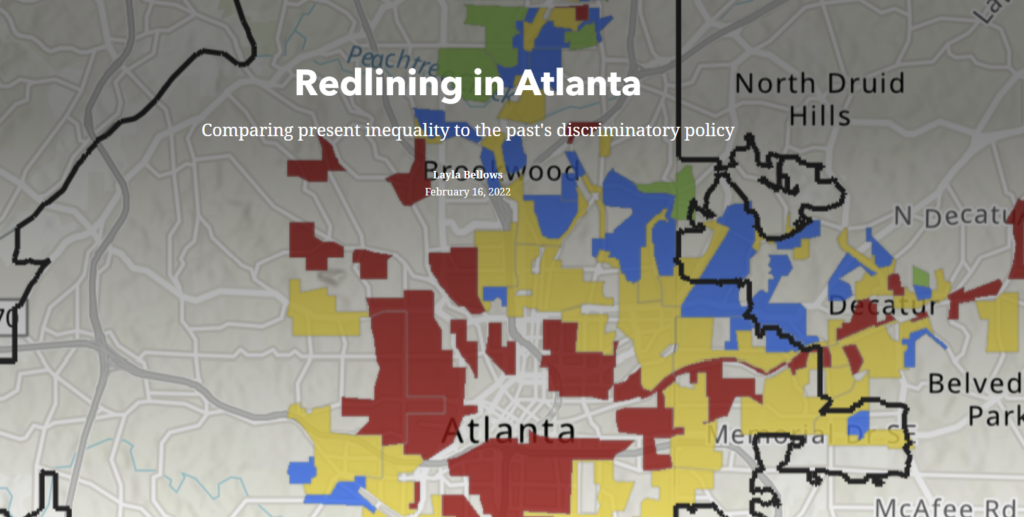
Redlining was far from the only policy that shaped geographies of exclusion for Black Americans, but it is one that we can look at on a map today and better understand how it shaped inequity. Click on the picture below to see a StoryMap that begins with a look at present-day segregation and inequity and compares them to the city’s past redlining maps.