
Monday Mapday
Maps showing themes and trends, published on Mondays
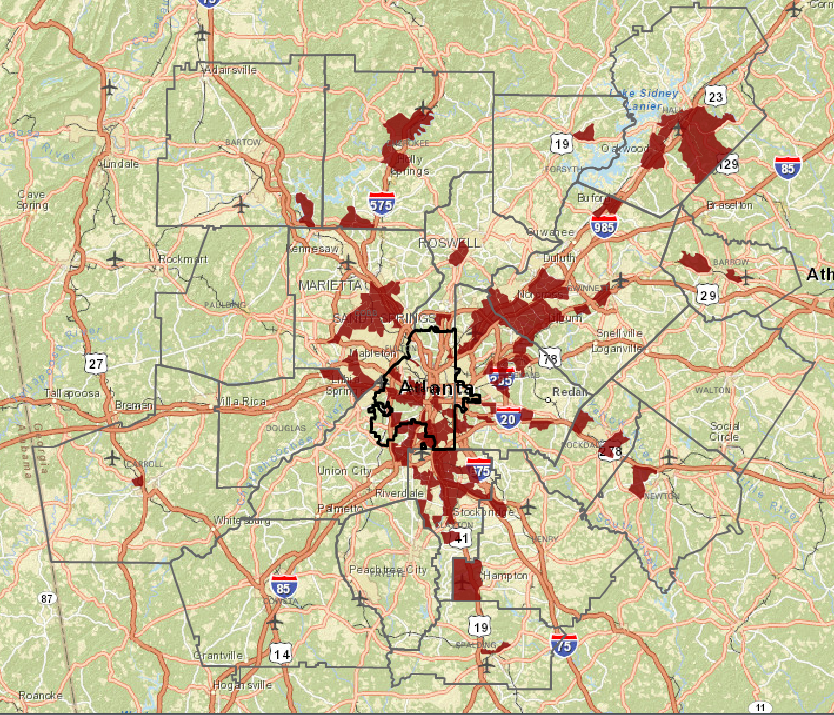
Monday Mapday: Population with no health insurance coverage
This map uses the most recent healthcare coverage data from the U.S. Census Bureau, showing the percentage of population with no health insurance coverage. The areas in brown are census tracts with the highest uninsured [...]

Monday Mapday: Community Involvement
Monday Mapday January 4, 2016: In keeping with the theme of New Year’s Resolutions, like getting more involved in your community, this map shows the percent of residents who participated in any public activity [...]

Monday Mapday: To Grandmother’s House We Go
Through the American Community Survey, the U.S. Census Bureau estimates the number of households where grandparents live with their own grandchildren. This map shows the percent of those households where the grandparents are responsible [...]

Monday Mapday: Home Sales Price by Zip Code
Monday Mapday: This map shows the average median home sales price by zip code in metro Atlanta for the time period of October 2014 - September 2015. Zillow reports monthly median home sales prices [...]

Monday Mapday: Esri’s 2015 Tapestry Segmentation
Esri's Tapestry Segmentation classifies neighborhoods into 67 market segments based on socioeconomic and demographic characteristics. These segments are summarized in 14 LifeMode groups based on similar traits. This map shows LifeMode Summary [...]

Monday Mapday: Population with a Computer
Will you be using your computer to make online purchases this Cyber Monday? This map shows the percentage of population with a computer for the biggest 100 metro areas in the U.S. [...]