
As noted recently, we all love a good index, especially when the index aggregates a bunch of different data into “buckets” that make more intuitive sense. And it helps when indices have been “around for a while”. In data geek parlance, “around for a while” translates to: ‘serve as a longitudinal dataset to allow for consistent evaluation of trends over time’.
The 2019 edition of the Brookings Institute’s Metro Monitor is such an index, and came out this month. It “rolls up” more than a dozen variables—from many different federal data sources- into four useful categories:
- Growth Index: assesses output, overall job growth market strength, and health of the small business community
- Prosperity Index: weighs changes in productivity, trends in average wages, and increasing or declining standard(s) of living
- Inclusion Index: includes earnings levels, poverty incidence, and spikes and/or drops in the unemployment of areas
- Inclusion by Race: comparing non-white to white subgroup earnings, poverty, and unemployment
The latest headlines for the Metro Monitor are (infographic):
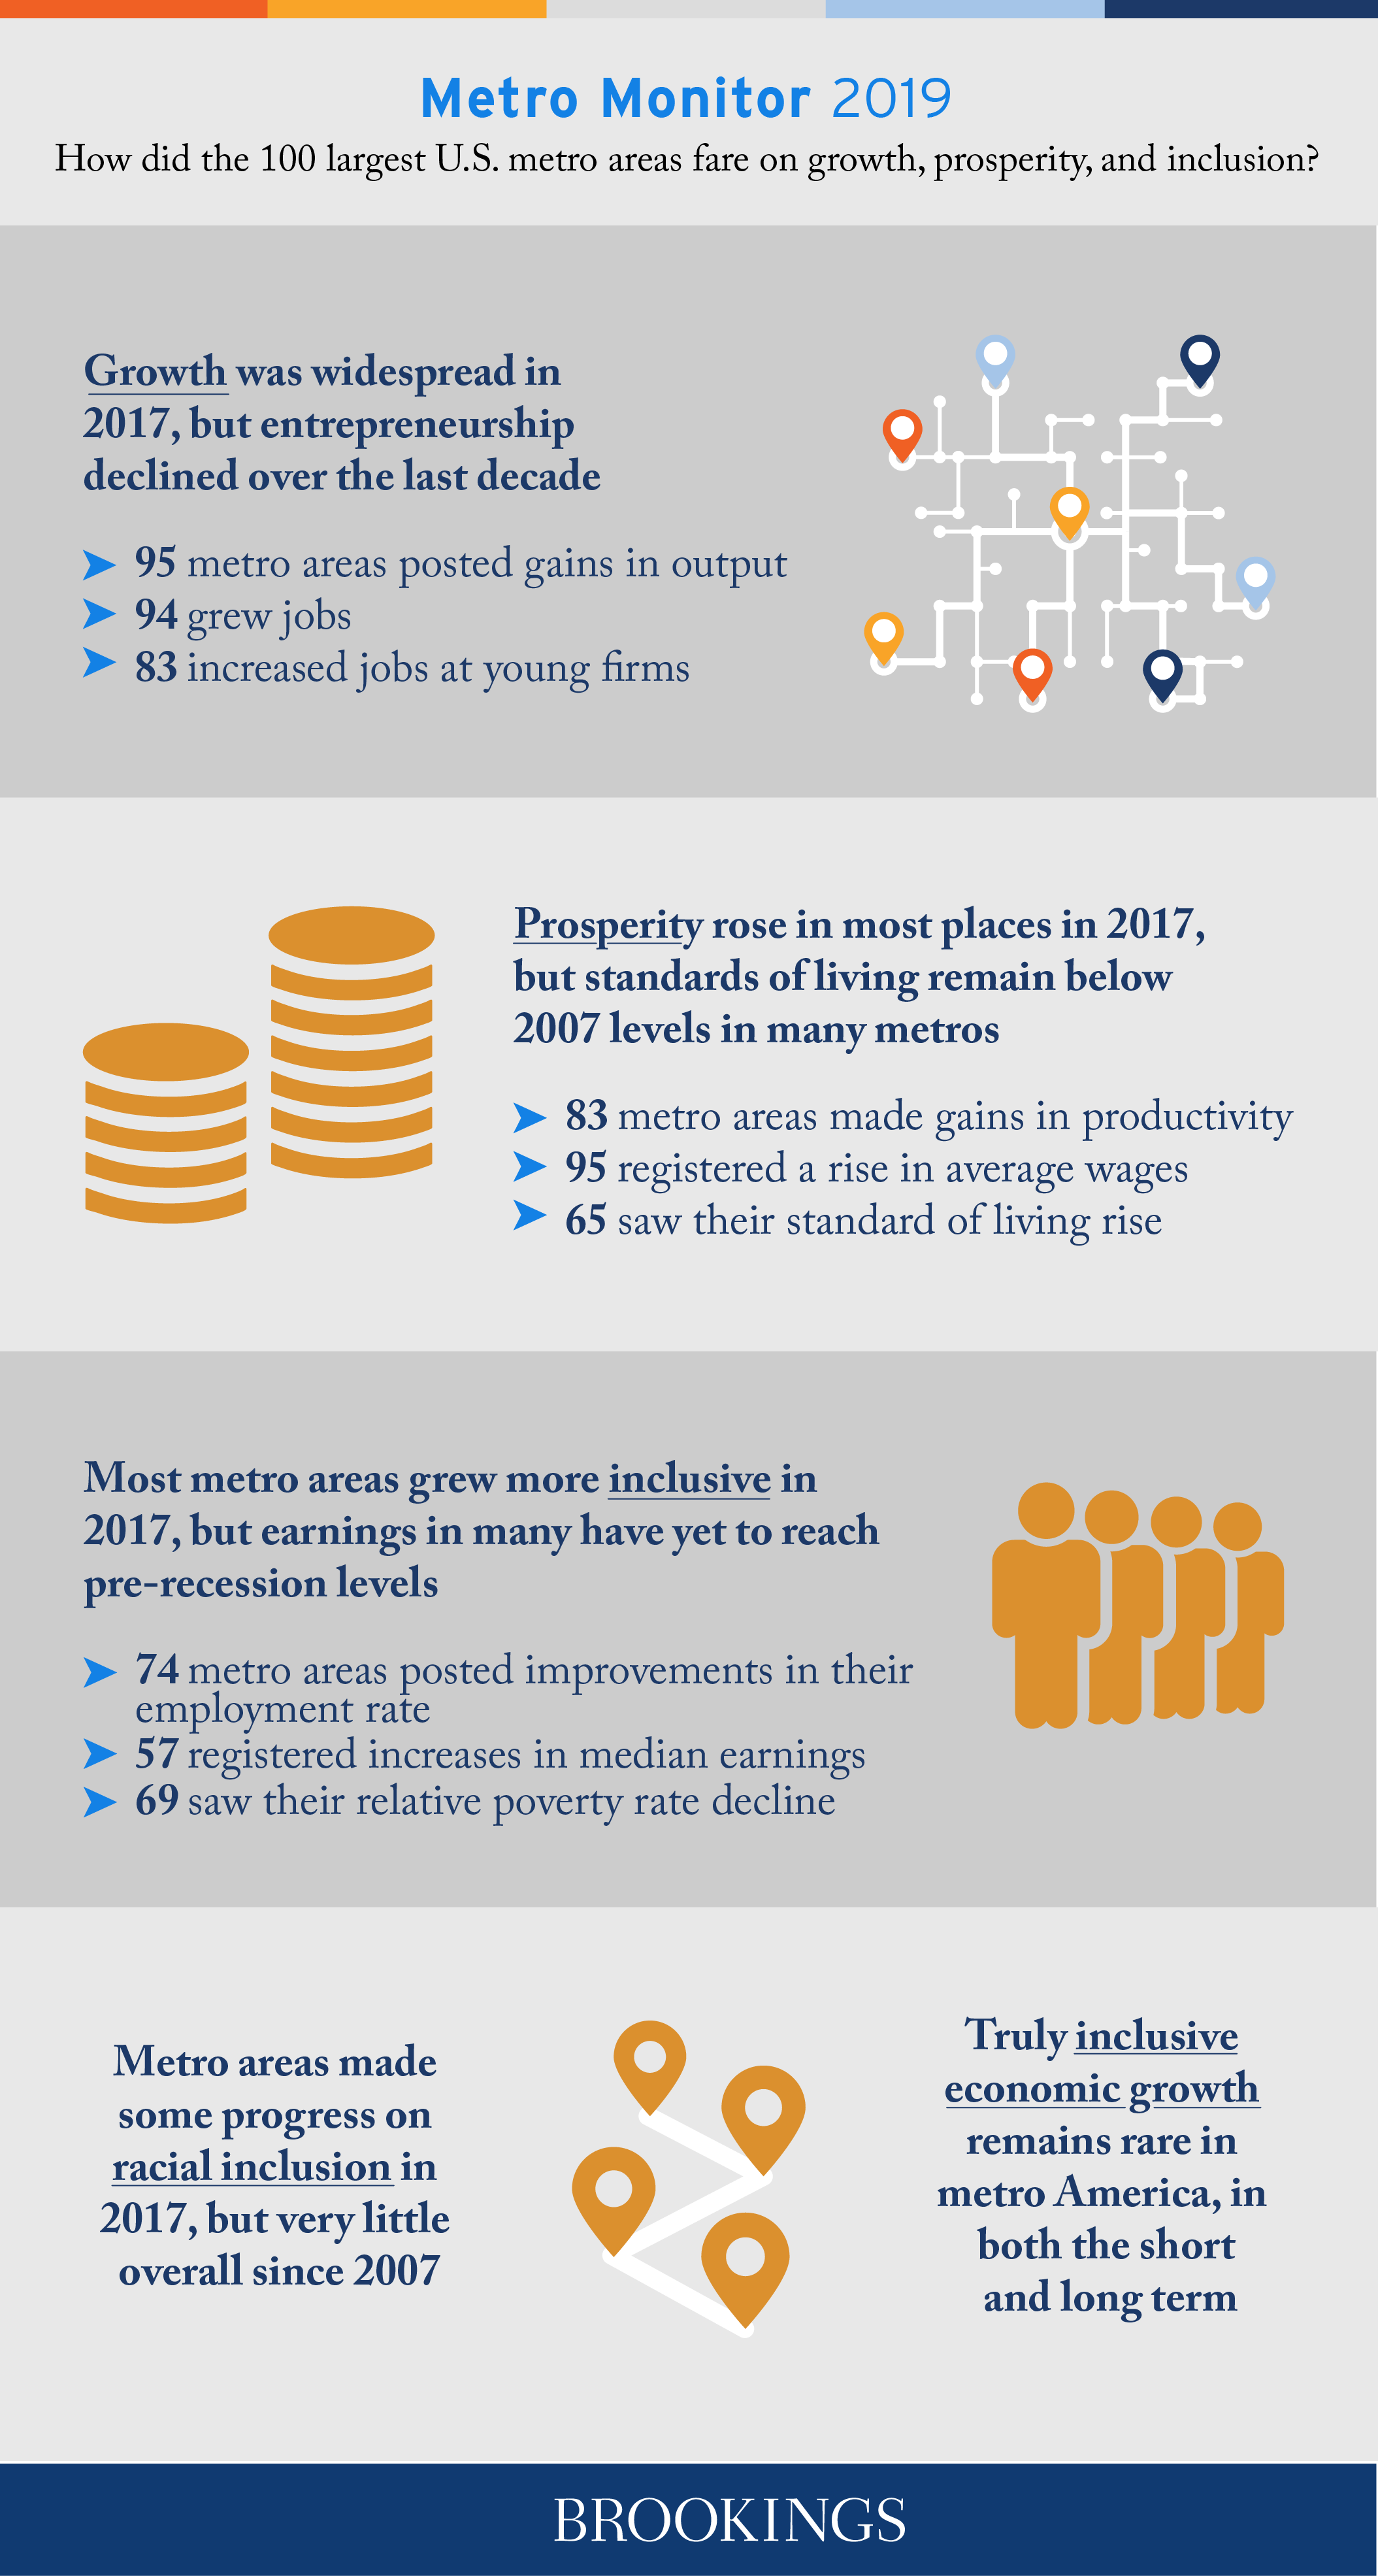
- Growth was widespread (among metros) in 2017, bouncing back from recessionary lulls to show a healthy ten-year trend
- Prosperity rose in almost all metros
- Most areas grew more inclusive, and made some progress on racial inclusion
Check out the image below for access to the full report including interactive “pin maps” that show relative strengths and weaknesses for all metros, countrywide, across the four categories.

<p>
Individual metro by metro reports are available, as you will see in the Atlanta example below.
Our metro ranks as follows, for the 2007-2017 period (among the 100 largest metros):
- 33rd for the Growth Index: across output, overall job growth market strength, and health of the small business community
- For the Prosperity Index: 48th in changes in productivity, trends in average wages, and increasing standard(s) of living
- Inclusion Index: 47th considering earnings, poverty, and unemployment
- Inclusion by Race: 71st in terms of the (size of) the disparity between non-white to white earnings, poverty, and unemployment
Single-year comparisons are also available through the interactive tools
