Incomes in the Atlanta metro area are growing again…just not very quickly, and a great deal more in some counties than in others. Data from the last three years show recovery from the slight declines or (at best) stagnation of the 2000 through 2013 period. And it is all relative, as median household incomes exceed the national median in seven of the ten Atlanta Regional Commission counties, and exceed the statewide median in all but one of those counties.
These observations come from data released this week by the U.S. Census Small Area Income and Poverty Estimates (SAIPE) Program cover the period between 2000 and 2016, for 3,141 counties and 13,236 school districts across the nation–for (a) median household income levels and (b) total and by age poverty rates. Median household incomes for counties range from a low of $22,045 to $134,609, and poverty rates range from 3.4 percent to 48.6 percent. For a very detailed look at trends nationwide, take a look at Small Area Income and Poverty Estimates: 2016.
Chart 1 below shows that, for the Atlanta 10-County area, median household incomes range in 2016 from a low of $44,598 in Clayton County to a high of $83,145 in Fayette County. In each of the ten counties, median incomes increased over the 16 year period, but between 2000 and 2013, levels actually fell in three counties. The relative rankings of several counties changed 2000-2016.
Median Household Income by County, State, and US: Trends 2000-2016

Source: US Census Bureau, SAIPE Program; ARC Research & Analytics analysis
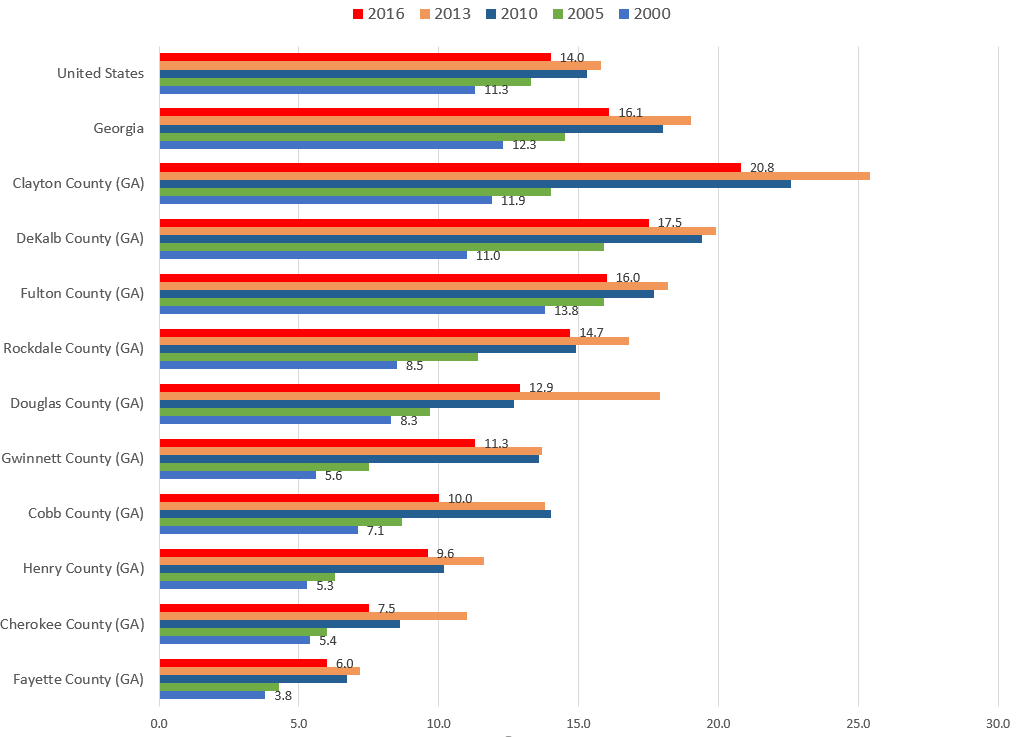
Chart 2 shows that poverty rates in the 10-County area, poverty rate declines correlate with the increases in median household incomes over the 16 years of data. Poverty rates in 2016 range from a low of 6.0 percent in Fayette (which also had the highest median household income) to a high of 20.8 percent in Clayton County (which had the lowest median household income). Trends in the last three years have been positive across the board, as in each of the ten counties, the poverty rate dropped between 2013 and 2016. As of 2016, the poverty rates in only two counties (Clayton and DeKalb) exceed the statewide average.
Chart 2: Poverty Rate Trends by County, State, Nation: 2000-2016

Source: US Census Bureau, SAIPE Program; ARC Research & Analytics analysis

