
Last fall, we saw that the regional survey Metro Atlanta Speaks reported that the #1 problem facing metro Atlanta is housing affordability (check out this blog post for more detail). Housing affordability is a measure of housing costs relative to income. Housing costs are also a classic supply-and-demand problem. Therefore, we can reasonably conclude reducing demand or increasing supply could help to decrease housing costs. However, metro Atlanta grew by over 350,000 people between 2020 and 2025, so it doesn’t appear that demand for additional local housing stock is dwindling anytime soon.
If demand for housing in the metro remains high, the obvious question remains: can we increase the supply to match? And, by extension, how much single- and multi-family housing are we building? While the answer to this question can be difficult to track precisely, we can approximate the supply of new housing units using housing units permitted at the county level via the U.S. Census Bureau’s Building Permit Survey (BPS). According to the BPS website, the purpose of this data product is “to provide national, state, and local statistics on new privately-owned residential construction.”
We actively maintain an interactive building permit tracker to see annual trends at a regional, county, and city level. Today’s post, however, will dive into just the trailing 18 months of data in the visual below. Use the toggle above the chart to view permits by type (single- or multi-family permits) or broken down by regional county.
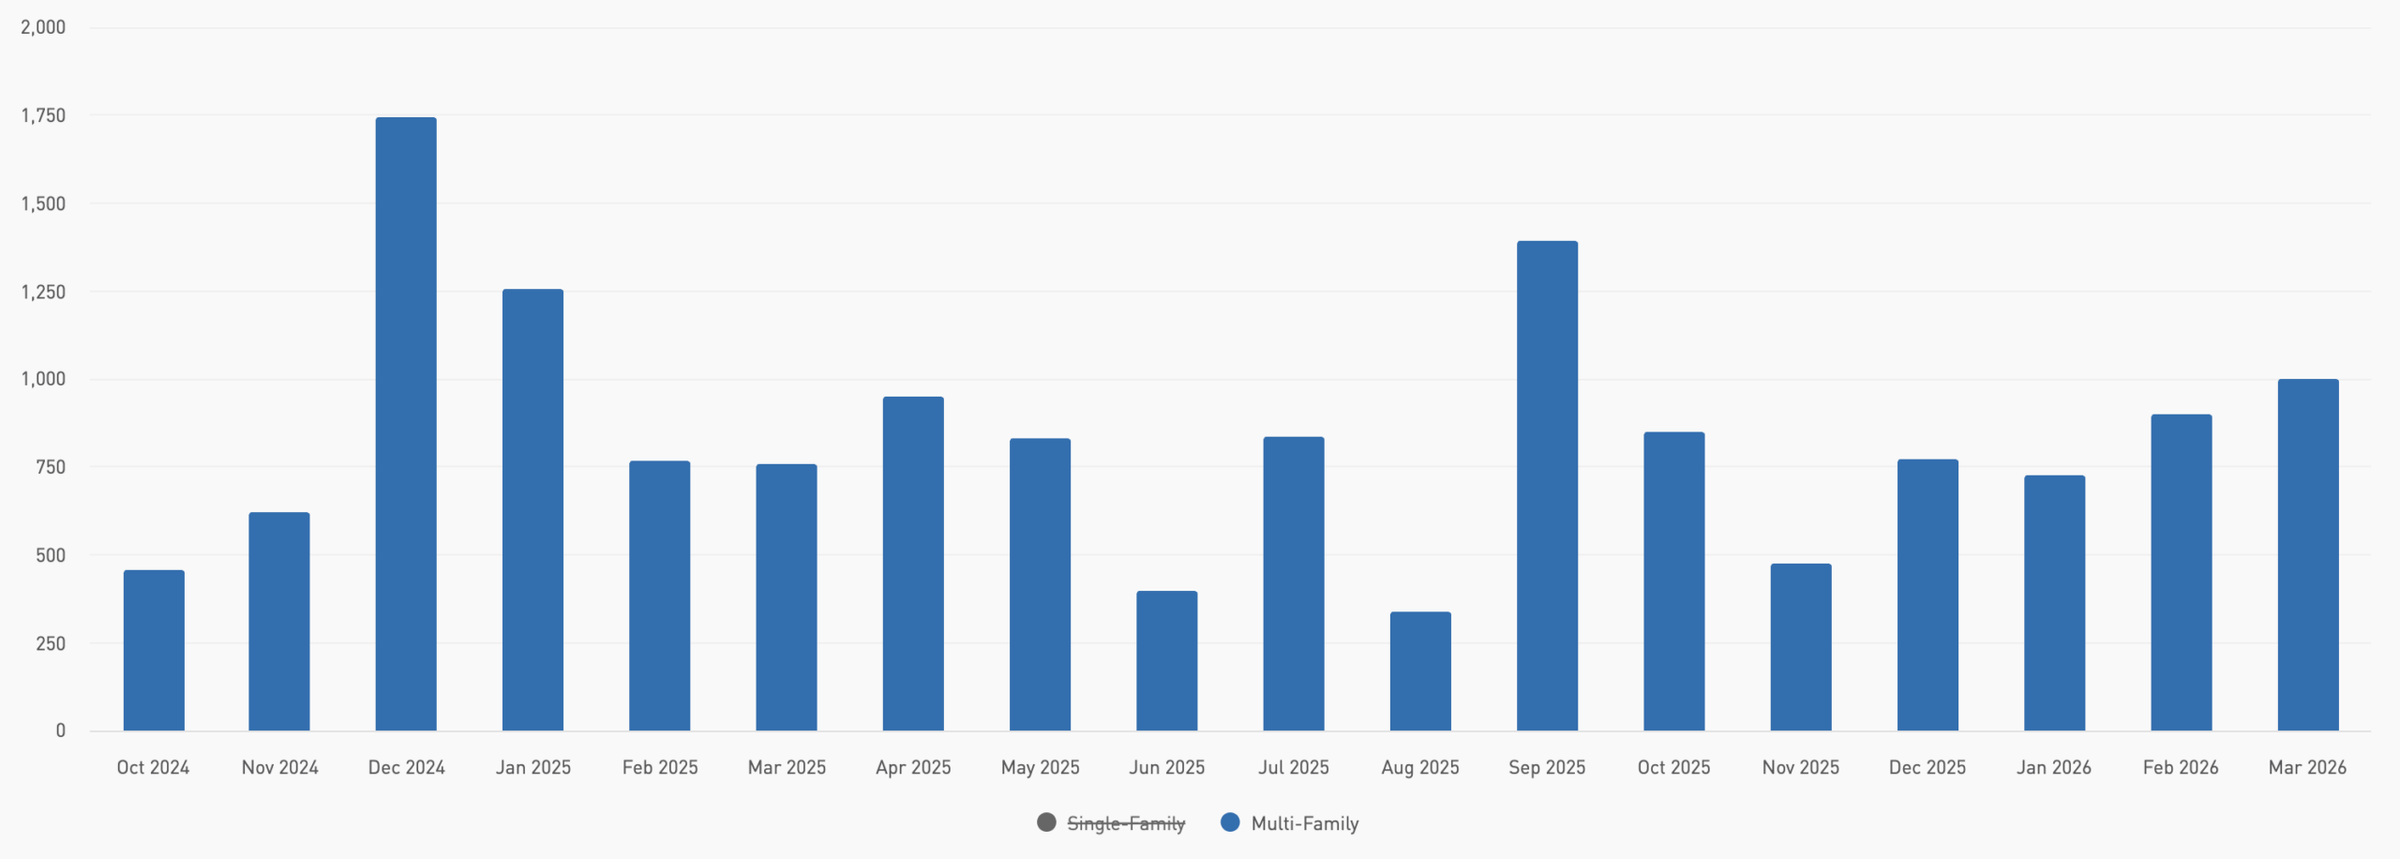
The 11-county region has seen steady month-over-month increases in permitting activity since November 2025, with the most recent estimates showing the total for March 2026 at 2,289 total units permitted. The high-water mark for total units permitted regionally was in December 2024 with 2,906. Multi-family units permitted have been much more volatile, ranging from a minimum of 336 units permitted in August 2025 to a maximum of nearly 1,750 in December 2024:
When looking at the county disaggregation, we see that Fulton County clearly leads the way regionally in terms of total units permitted. The metro’s top 5 counties in terms of units permitted are as follows: Fulton, Gwinnett, Henry, Forsyth, and Cherokee. Fulton County’s trends have fluctuated in a somewhat back-and-forth pattern for much of the past 6 months. Gwinnett County, meanwhile, has been much more consistently permitting around 300 units a month going back to December 2025, with a peak in April 2025 of nearly 600. To see a more detailed breakdown for each of these counties into single- and multi-family units permitted, see the interactive permit tracker above.
Note: the above monthly figures are revised monthly figures but are subject to revision with the final, benchmarked numbers released in May of each year. The 2025 annual revision was released May 14, 2026.
________________________
Image credit: www.rismedia.com