In the latter part of this month, we want to commemorate National Black (African American) History Month with several posts that, focusing on the Black population, emphasize the continuing challenges (as well as some improvements in) socieconomic equity. This blog post will look at current and past trends in median household income by race and ethnicity.
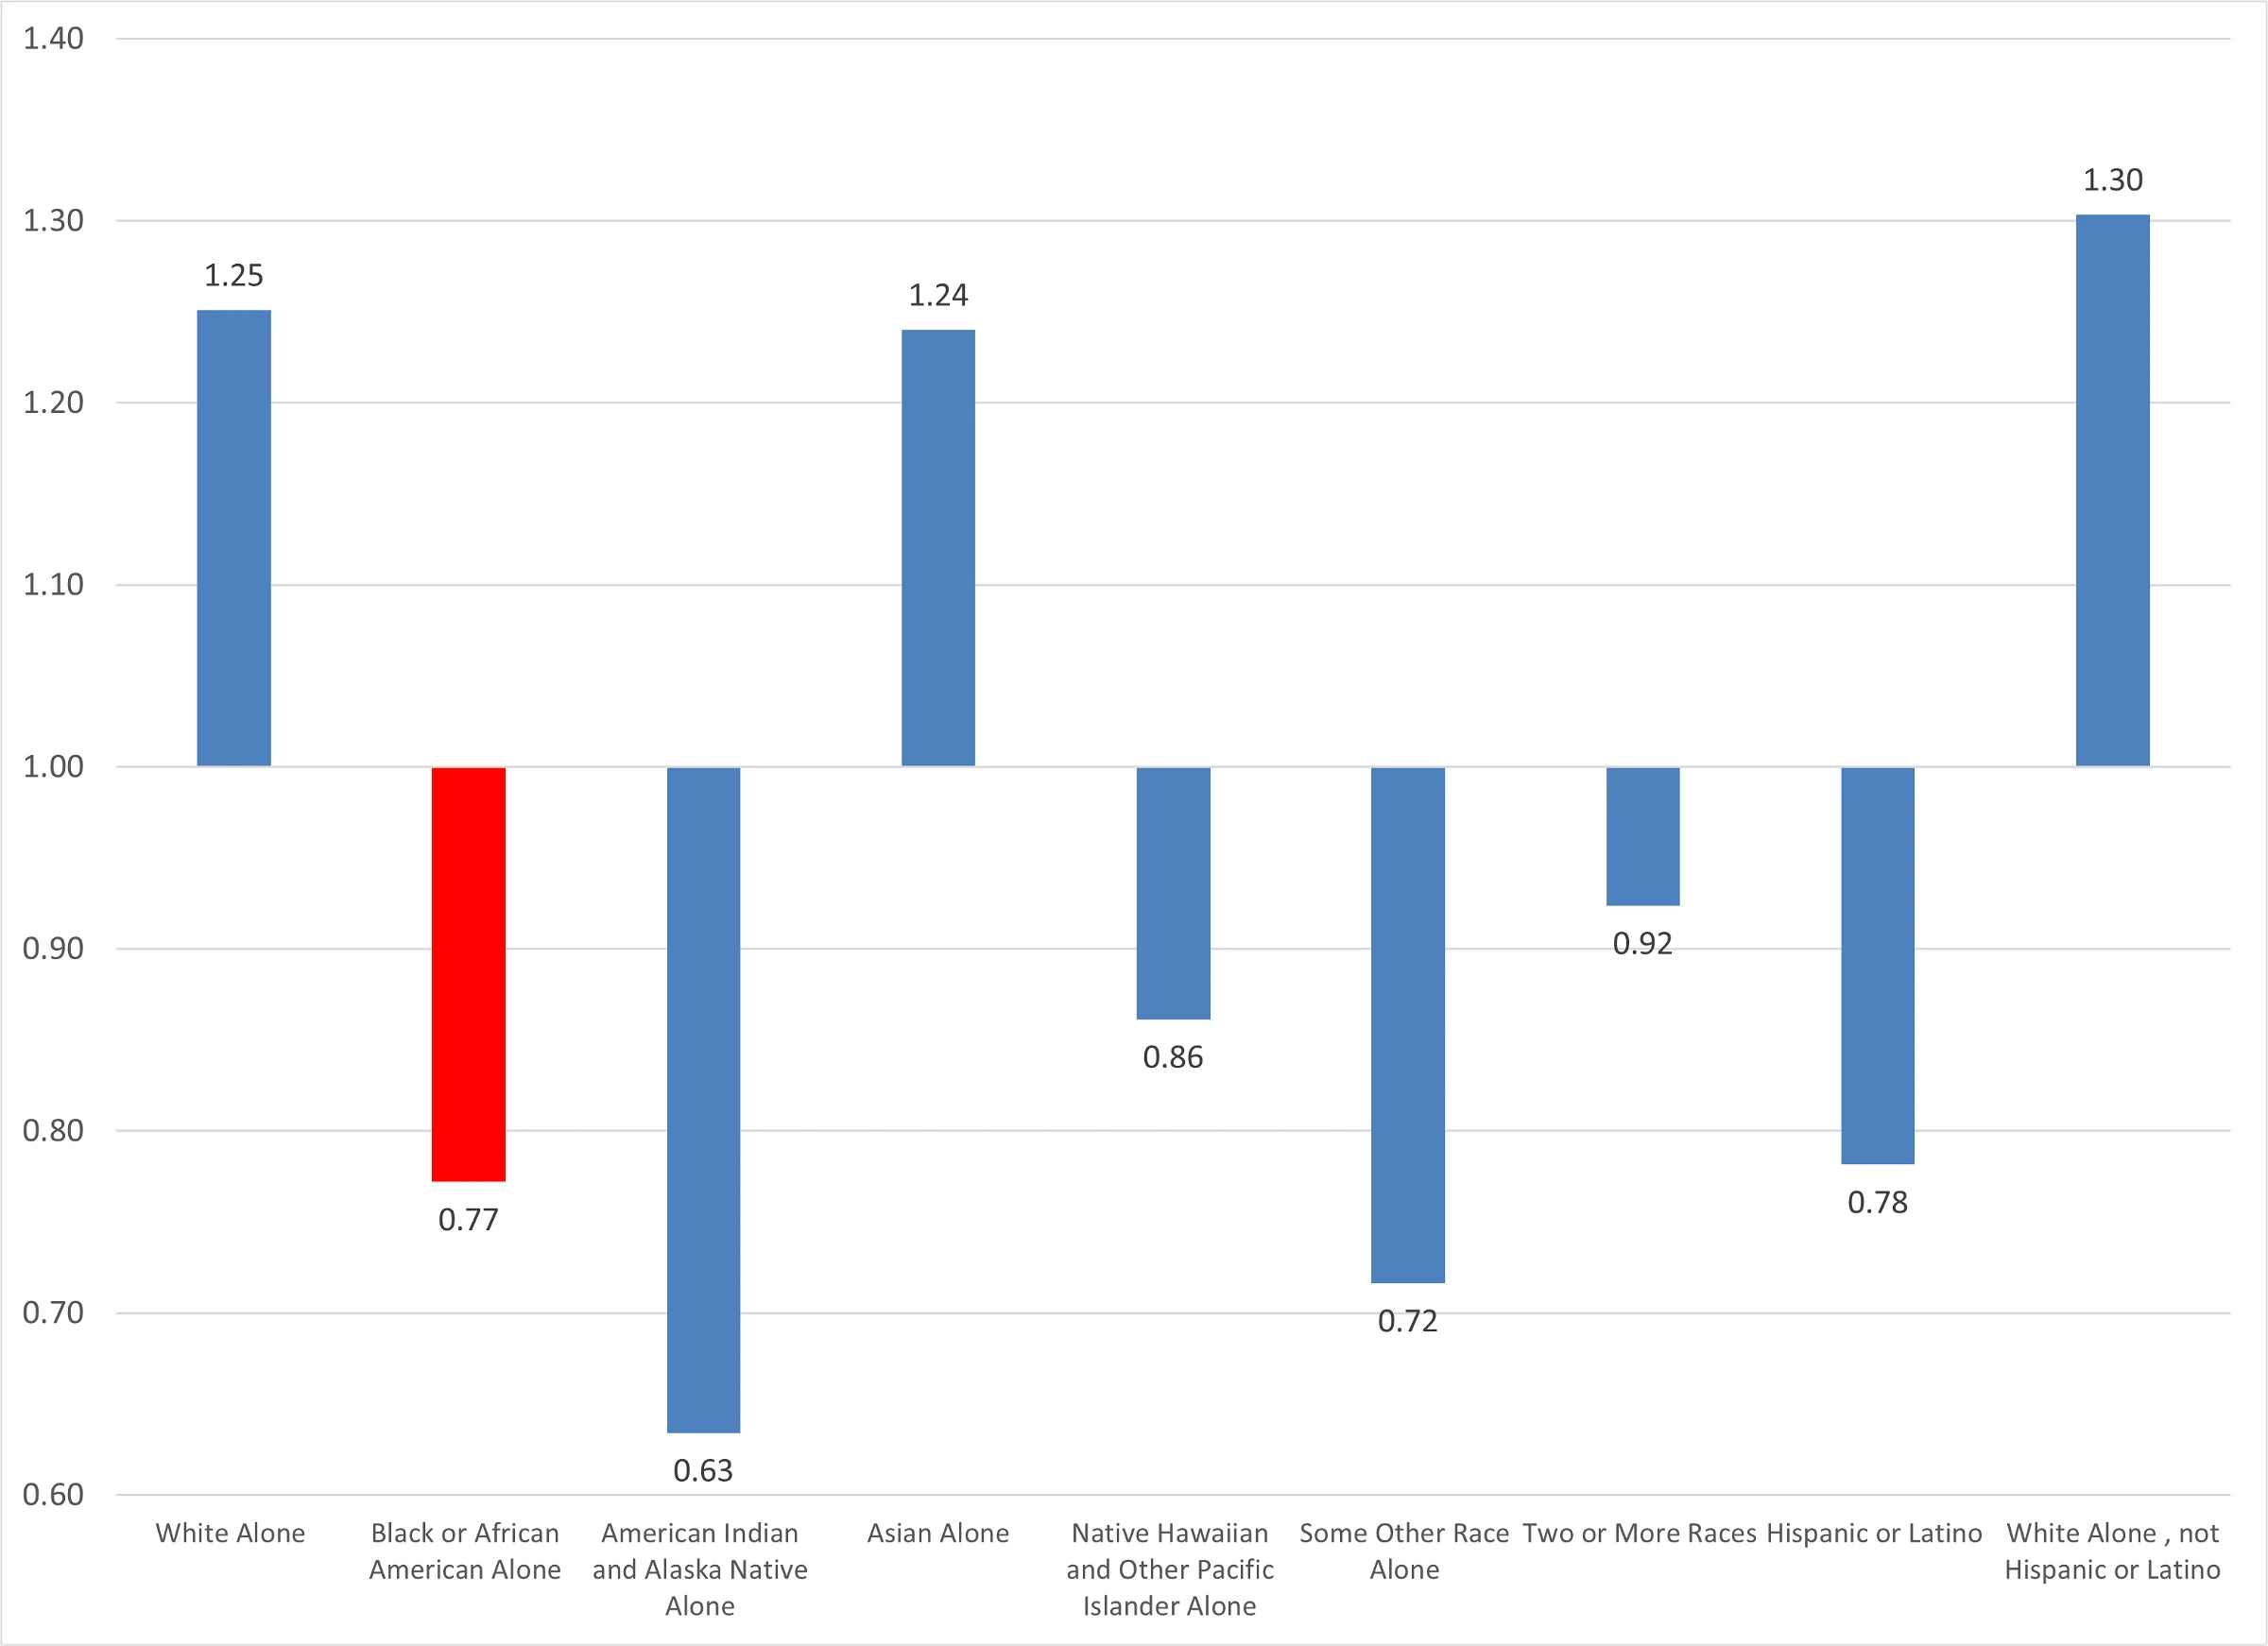
Figure 1 shows that the median Black household income from the latest (2017-2021) five-year American Community Survey is substantially below that of white and Asian households, and just below the median for Hispanic/ Latino households. Figure 2 moves on provide a ratio comparison between the median value for each race/ ethnicity category and the overall median. Black household income is 77 percent of the media– this means that the median for Black households is roughly 3/ 4 of that of the median household across all races and ethnicities.
Figure 1: 2021 Median Household Income by Race and Ethnicity; 11-County ARC (Source: Census American Community Survey 2017-2021; ARC Research & Analytics)

Figure 2: Ratios of Median By Race and Ethnicity, to Overall Median (2021); 11-County ARC (Source: Census American Community Survey 2017-2021; ARC Research & Analytics)

So there’s a gap: absolute dollar amounts (and ratio comparisons) of Black median household income remain below overall levels. But the gap seems to have narrowed–relatively–over the last decade, as our economy has emerged from the Great Recession. A look at Figure 3 (a deep dive on Black median household income by county, over time, adjusted to 2021 dollar values) gives a good example of the extent of the impact of that event: Black median household income, adjusted to 2o21 dollars, declined from 2000 to 2021* everywhere in the 11-counties, except Fulton. Over the shorter period of 2011* to 2021*, however, there have been increases in Black median income in seven of the eleven counties (still were declines over that period in Clayton, Fayette, and Henry). And finally, Figure 4 reveals that these increases in Black median household income have, on a percentage basis, exceeded those of white households–except in DeKalb and Fayette .
* five-year data products for 2007-2011; 2012-2016; and 2017-2021
Figure 3: Trends Over Time in Black Median Household Income: 11-County ARC (Source: Census Bureau’s American Community Survey and Decennial Census from 2000 to 2021; ARC Research & Analytics)

Figure 4: Percentage Change in Medians By Race and Ethnicity from 2011 to 2021: , 11-County ARC (Source: Census American Community Surveys; ARC Research & Analytics)


