In recognition of National Pet Day (April 11), we celebrate our furry and feathered friends (and scaly ones too) by looking at pet ownership in Metro Atlanta.
The American Housing Survey (AHS), a partnership between the Department of Housing and Urban Development and the U.S. Census Bureau, is administered every other year. This survey delves much deeper into housing issues than the American Community Survey (ACS) questionnaire but surveys a much smaller sample. So, unlike the ACS, which provides data down to the Census tract, the AHS only provides data for the nation, several states, and the 15 largest metro areas in the country– including Atlanta. The AHS includes a few special topics in each iteration, including a section on pet ownership in 2021. Unfortunately, since this topic rotated in just for the 2021 questionnaire, we can’t compare with 2019 data to look for those “pandemic puppy” trends we all keep reading about.
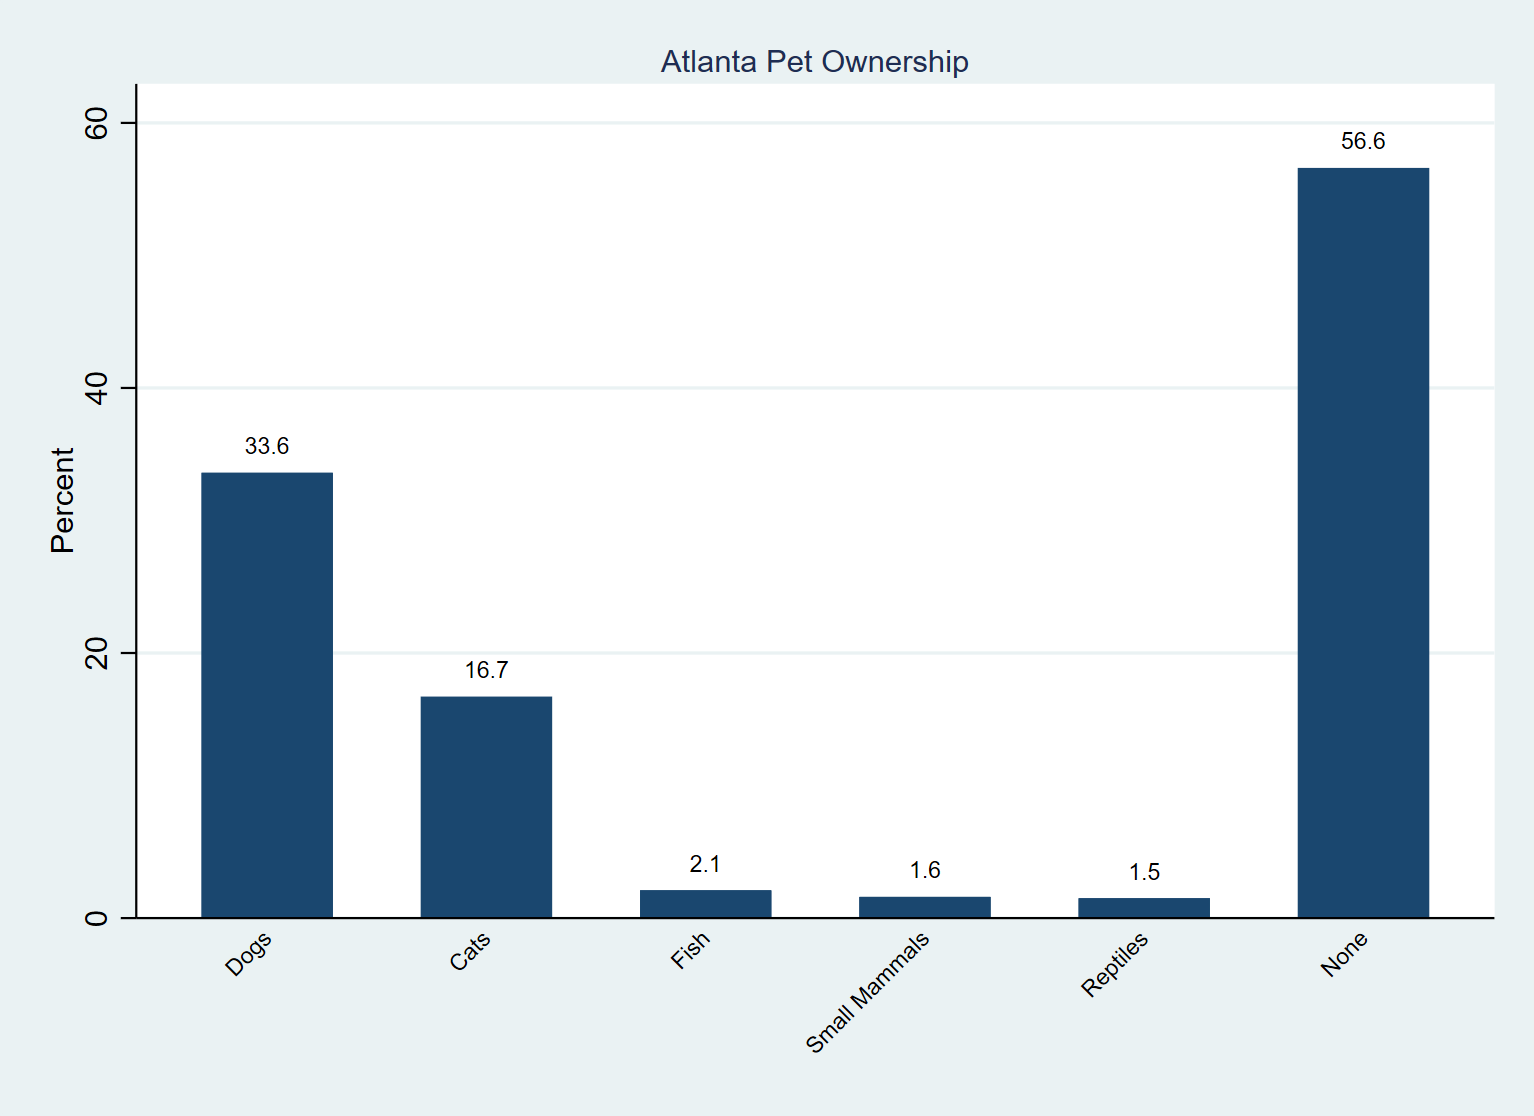
As Figure 1 shows, 43.4% of Atlanta MSA households have at least one pet; dogs and cats are the most popular pets, with dog-owning households outnumbering cat-owning households about two-to-one. Note that the bar totals exceed 100% because a household can have more than one kind of pet. And further, the Atlanta estimate for pet birds did not meet publication standards, perhaps due to Dirty Bird data (boom-cha).
Figure 1: Pet Ownership by Household in the Atlanta MSA (Source: American Housing Survey; ARC Research & Analytics Department)

So how does the 29-County Atlanta Metropolitan Area compare with its peers in terms of pet ownership?
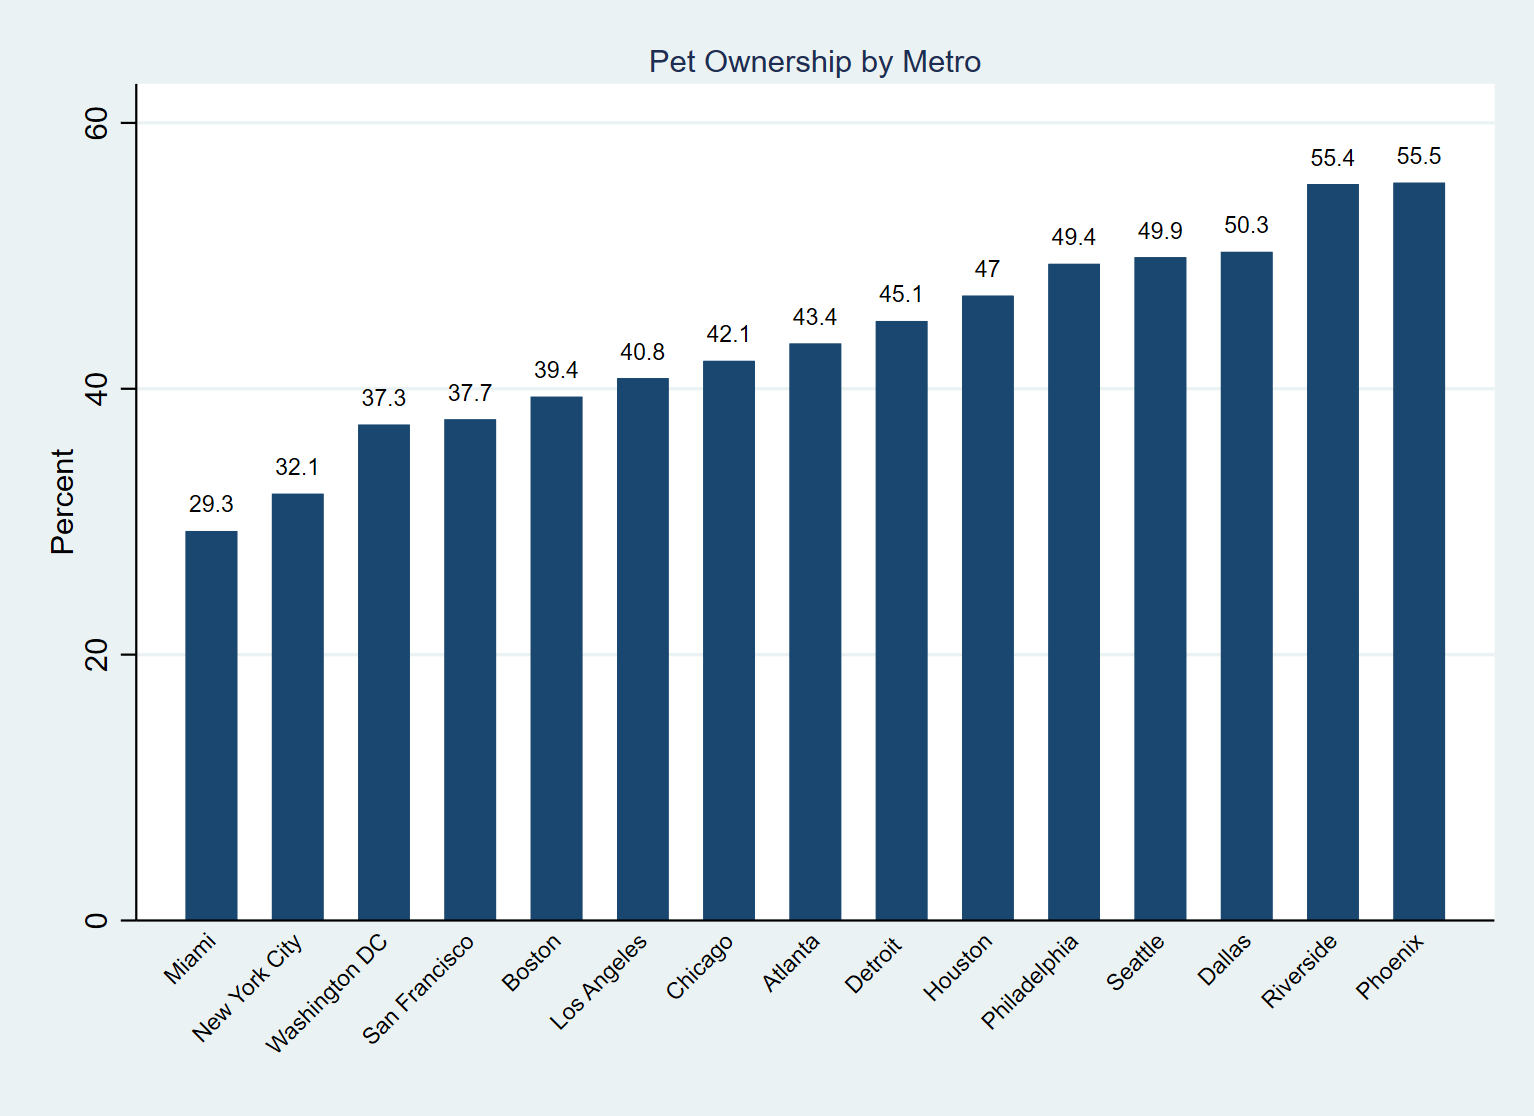
As Figure 2 shows, Atlanta is right at the median in terms of pet ownership among the 15 largest metro areas, occupying 8th place. A majority of households in Phoenix, Riverside, and Dallas have at least one pet, while Miami and New York City appear to be the least pet-friendly.
Figure 2: Comparative Metro Shares of Households Owning One or More Pet(s) (Source: American Housing Survey; ARC Research & Analytics Department)

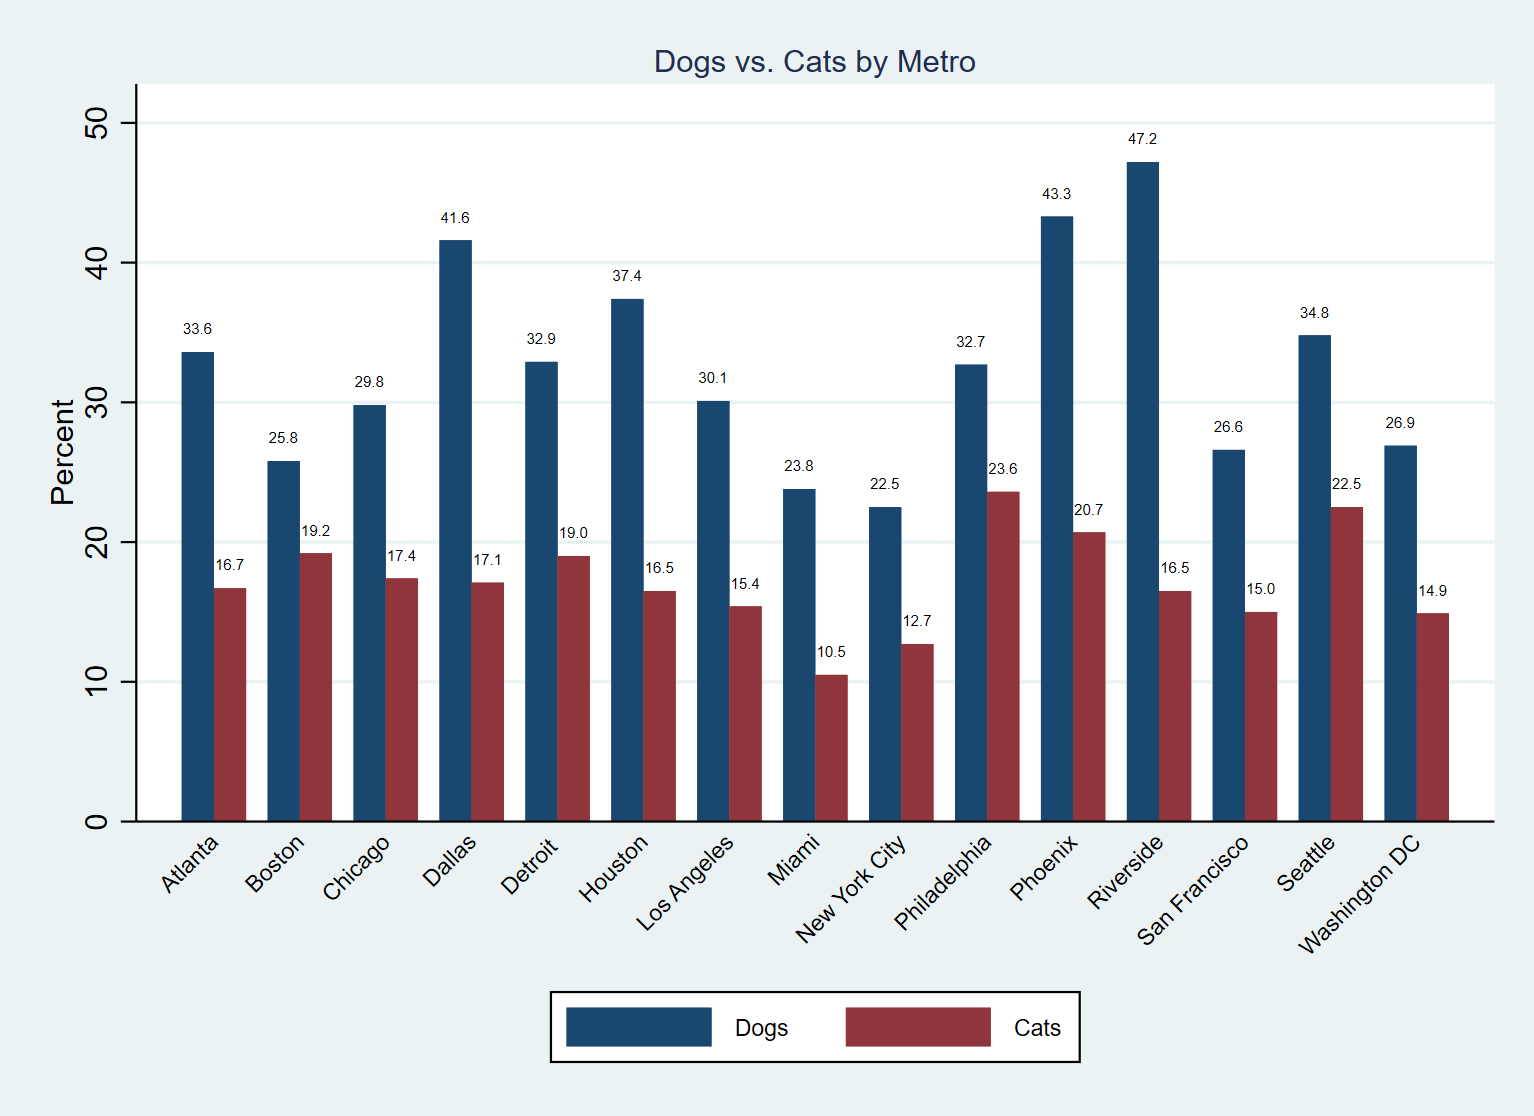
Figure 3 shows that Atlanta is the 6th most dog-friendly of the fifteen largest metros, with 33.6% dog ownership. Riverside, Phoenix, and Dallas have the greatest dog ownership rates, while Philadelphia and Seattle have the largest proportions of cat owners.
Figure 3: Shares of Households Owning Dogs and Cats: Metro to Metro (Source: American Housing Survey; ARC Research & Analytics Department)

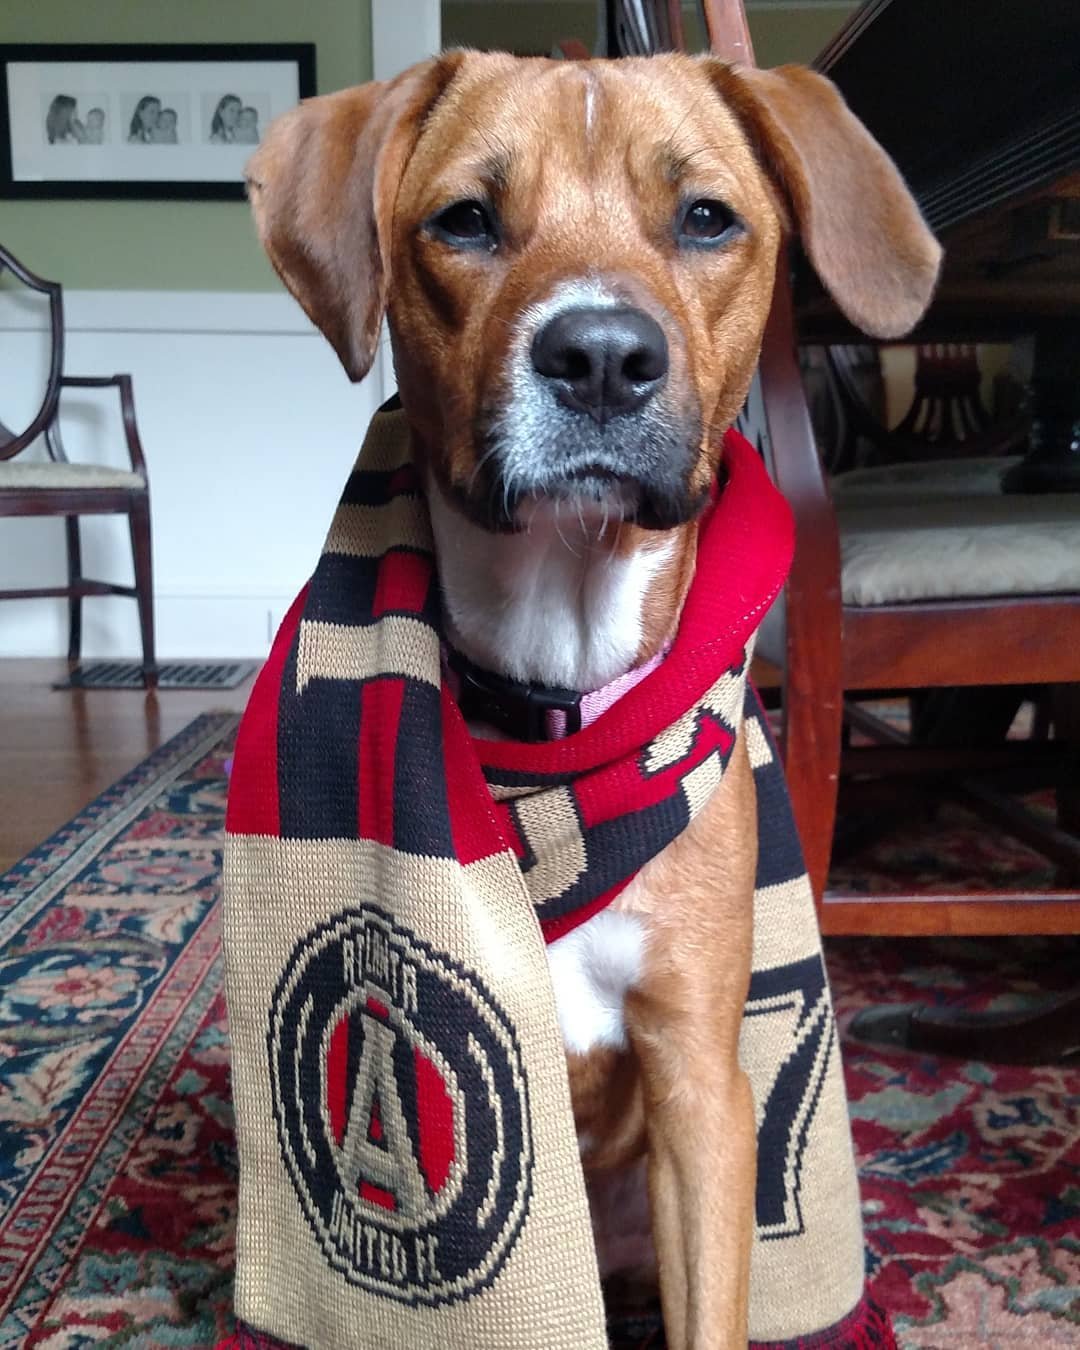
Finally, Figure 4 shows that Abby Wambark wants you to get a rescue pet.
Figure 4: Abby Wambark (Source: Blog Author and Pup Owner, all rights reserved)


