In an earlier blog post, we discussed how low turnout rates for the 2021 Georgia Milestones assessments rendered the resulting data of limited use. So how did we fare in 2022? This entry will focus specifically on the 3rd Grade English Language Arts (ELA) exam, which is an important yardstick that measures the degree to which students have successfully pivoted from “learning to read” to “reading to learn”– a transition crucial to successful learning in 4th grade and beyond.
When reporting on the recently-released 2022 results, Ty Tagami –in a recent Atlanta Journal Constitution story — put an asterisk on the data, by correctly noting that the Georgia Department of Education (GADOE) did not report participation rates. While we do not know the precise number of students enrolled on the testing dates, we can use the results of the Spring 2022 student Census (enrollment as of March 4, 2022) as a close approximation.
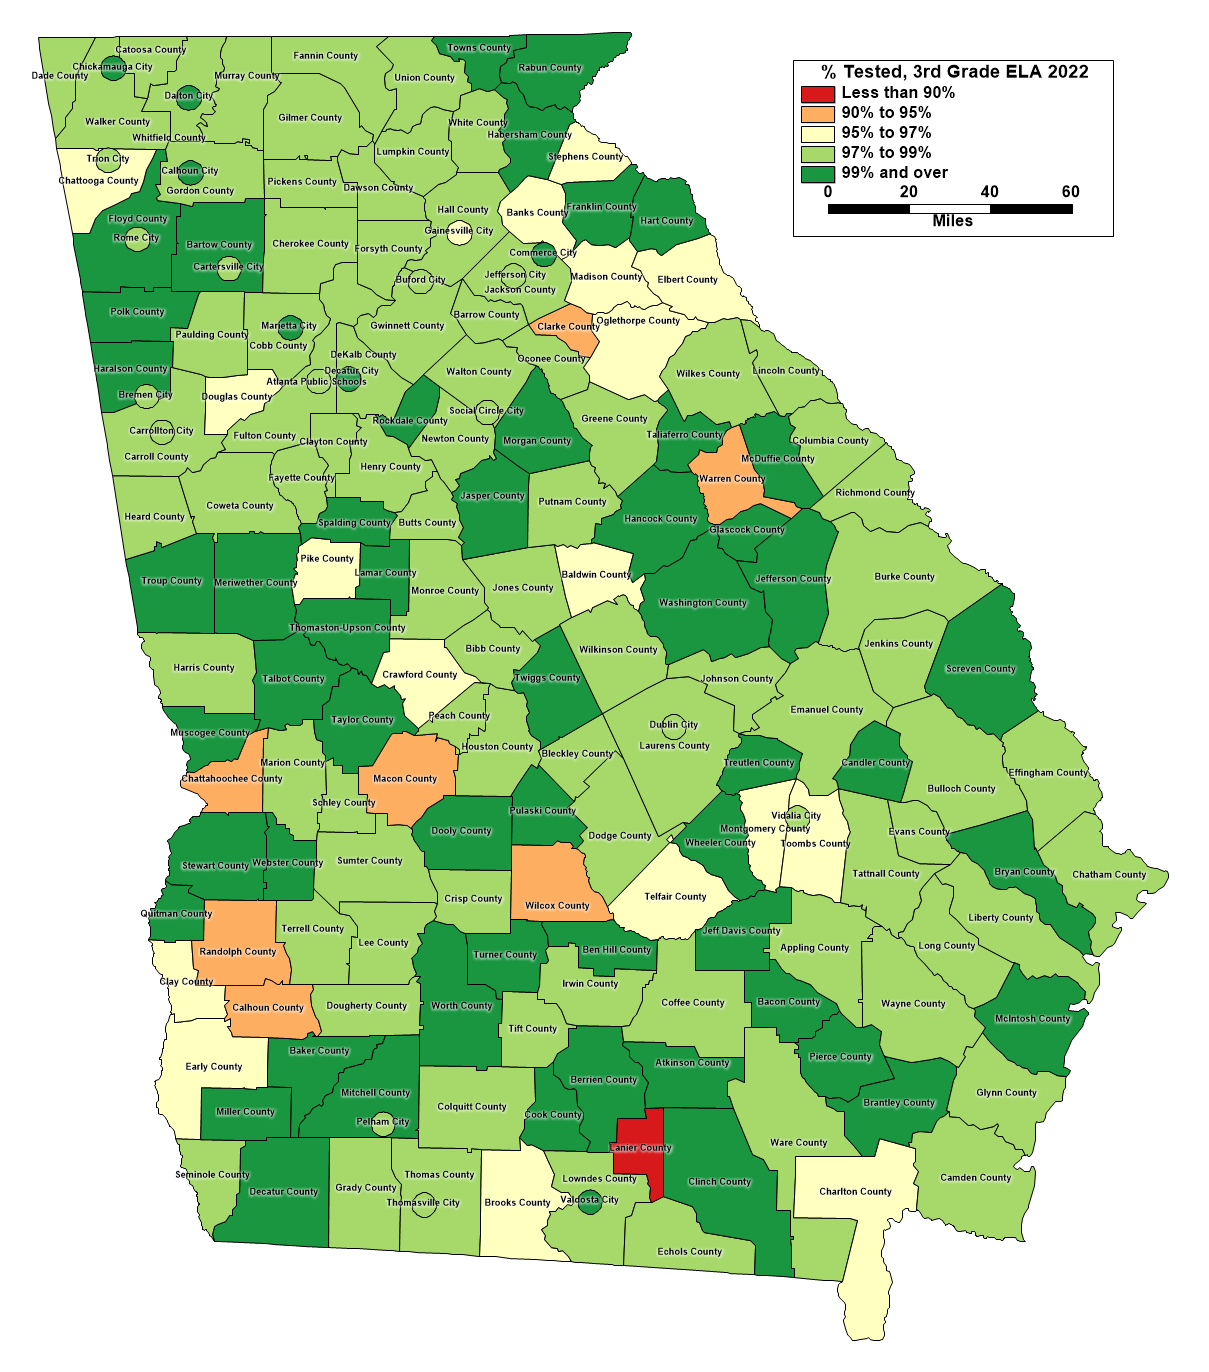
Using those enrollment numbers as the denominator, we find that only one district in the state had less than 90% participation, and all but eight statewide– including all districts within the Atlanta metro area– achieved or exceeded the 95% participation rate target set by the federal government. Contrast this to last year, when over half of Georgia’s school systems failed to meet this threshold (though for obvious good reasons). Given this finding, we believe that the asterisk can come off of the results. The Georgia Department of Education (GA DOE) did not report participation rates simply because they don’t need to be considered when interpreting the results. And that is good news, given the traditional desire to use the Milestones results to identify emerging needs and guide investments in our education system.
Exhibit 1: County-Level Participation Rates for 3rd Grade ELA, 2022 (Source: Georgia Department of Education; ARC Research & Analytics)

The 2022 results themselves, however, are not particularly “good news”. And this should come as no surprise, given the myriad challenges that educators, parents, and students faced in the two years leading up to the 2022 exams.
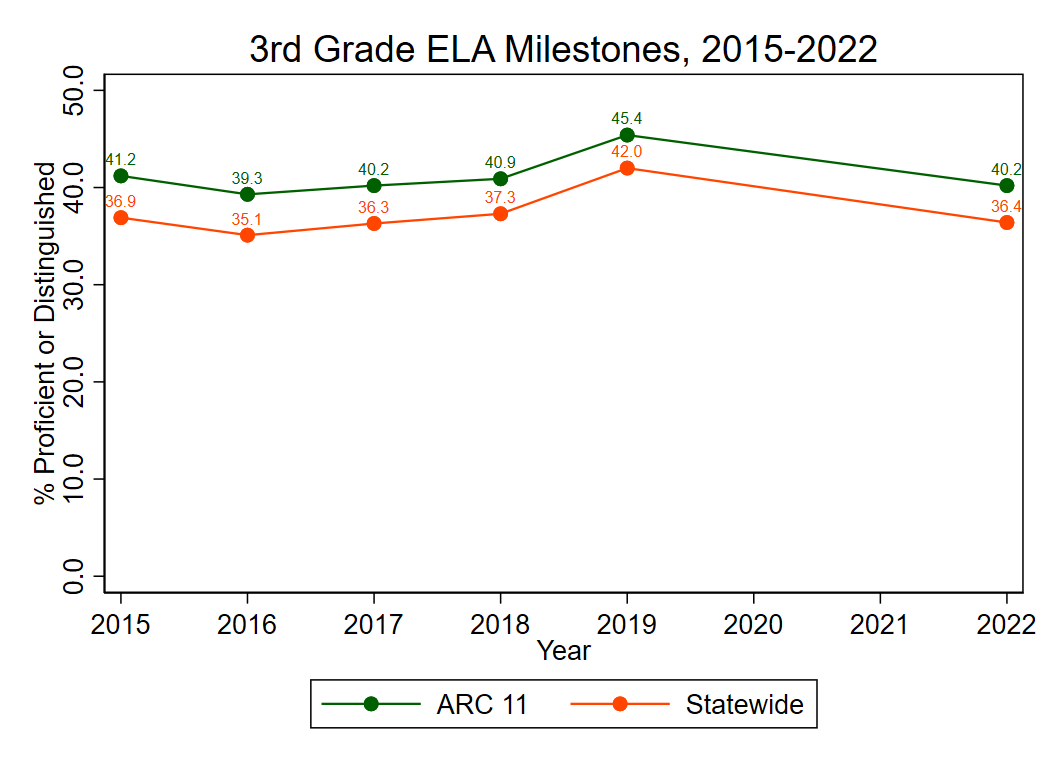
Exhibit 2 below depicts performance on the Georgia Milestones since 2015– the first year that they were administered– both statewide and for the school systems serving the 11 member counties of the Atlanta Regional Commission. No data are shown for 2020, when the tests were canceled due to the pandemic, or for 2021, due to the turnout and response bias issues discussed in the aforementioned previous blog post . As the graph shows, the pandemic effectively erased the positive trend from the years preceding the pandemic.
Exhibit 2: Passing Rates for 3rd Grade ELA, 2022, ARC Region and Statewide (Source: Georgia Department of Education; ARC Research & Analytics)

What districts have felt the greatest negative impact (on Milestones scores)? To answer this question, we calculated the percent change in the share of students scoring “proficient” or higher on the 3rd grade ELA exam (% Proficient or higher in 2022 – % Proficient or higher in 2019)/ % Proficient or higher in 2019). We used this measure instead of simply subtracting the two values– as higher performing districts potentially had farther to drop in absolute terms.
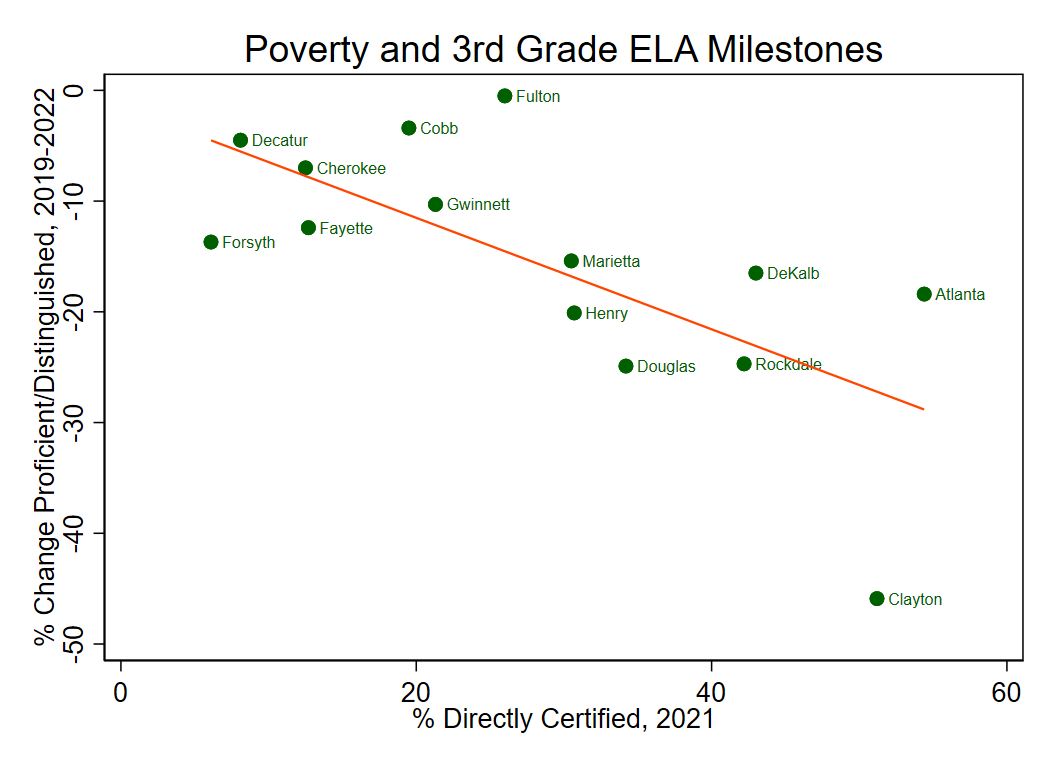
Exhibit 3 below describes the relationship between poverty (measured as the percentage of students “Directly Certified” for income-based programs) and the change in performance on the 3rd Grade ELA between 2019 and 2022 for the school systems serving the ARC region [Nerd note: for those interested in why Direct Certification is a better measure than free/reduced price eligibility, see this discussion from the Governor’s Office of Student Achievement: ].
Exhibit 3: Comparing Poverty Rates and ELA Pass Rates, 2022, ARC Region Counties (Source: Georgia Department of Education; ARC Research & Analytics)

As we can see in the above chart, in the ARC 11-County Region the greater the percentage of students below poverty in a given district, the harder hit to that same district in terms of lost learning opportunities (note: the value of r=-.68, which indicates a strong relationship). This same correlation is in evidence statewide as well, though it is somewhat weaker (r=-.32).

