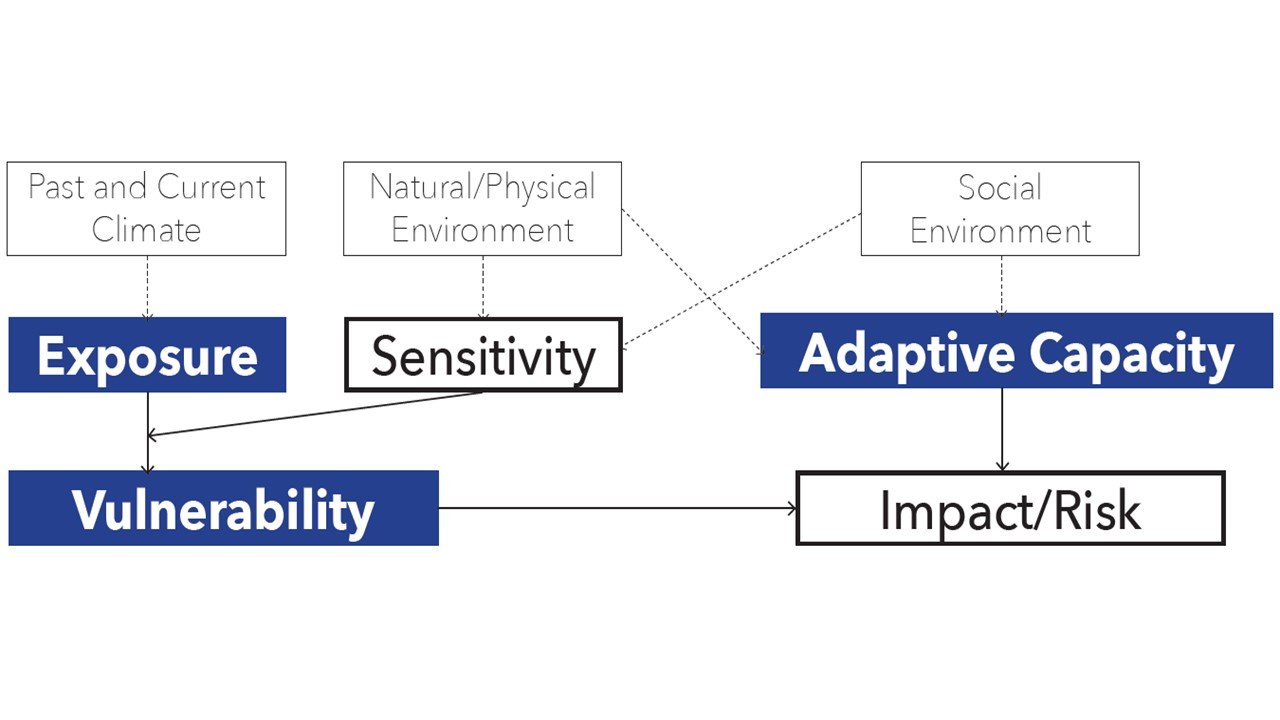
August in Atlanta is known for delivering a knockout punch of heat. However, not everyone feels it in the same way. In fact, the impact of climate change is deeply intertwined with patterns of disparity, making people from under-privileged socioeconomic groups more vulnerable to extreme heat events than others. To break it down, the disparate impact of heat exposure can be conceptualized as the interplay between vulnerability and adaptive capability, both of which are collectively determined by the climate exposure, the physical environment, and the social environment. See Figure 1 below.
IMPORTANT NOTE: This post was a collaboration of two of the greatest summer interns of the anthropecene era: Yilun Zha and Pedro Ortiz
Figure 1: The Conceptual Model of Climate Change Impacts (Adapted from IPCC Report)
Among all the determinants of heat vulnerability, housing plays a vital role in many regards. “Adaptive capacity” refers to the “the degree to which a system is susceptible to, or unable to cope with, adverse effects of climate change” (Brooks, 2003). In this case, our housing system, as a series of policy choices, has functionally failed thousands of people in the Atlanta region from the following perspectives:
Household Energy Burdens
The energy burdens are commonly defined as household energy bill divided by household income. On a regional scale, four out of five cities with the highest energy burdens in the US are located in the southeast region, including Atlanta in 4th. Most of the prime contributors to energy burdens are housing-related, including poor housing conditions and high rental costs as a percentage of income.
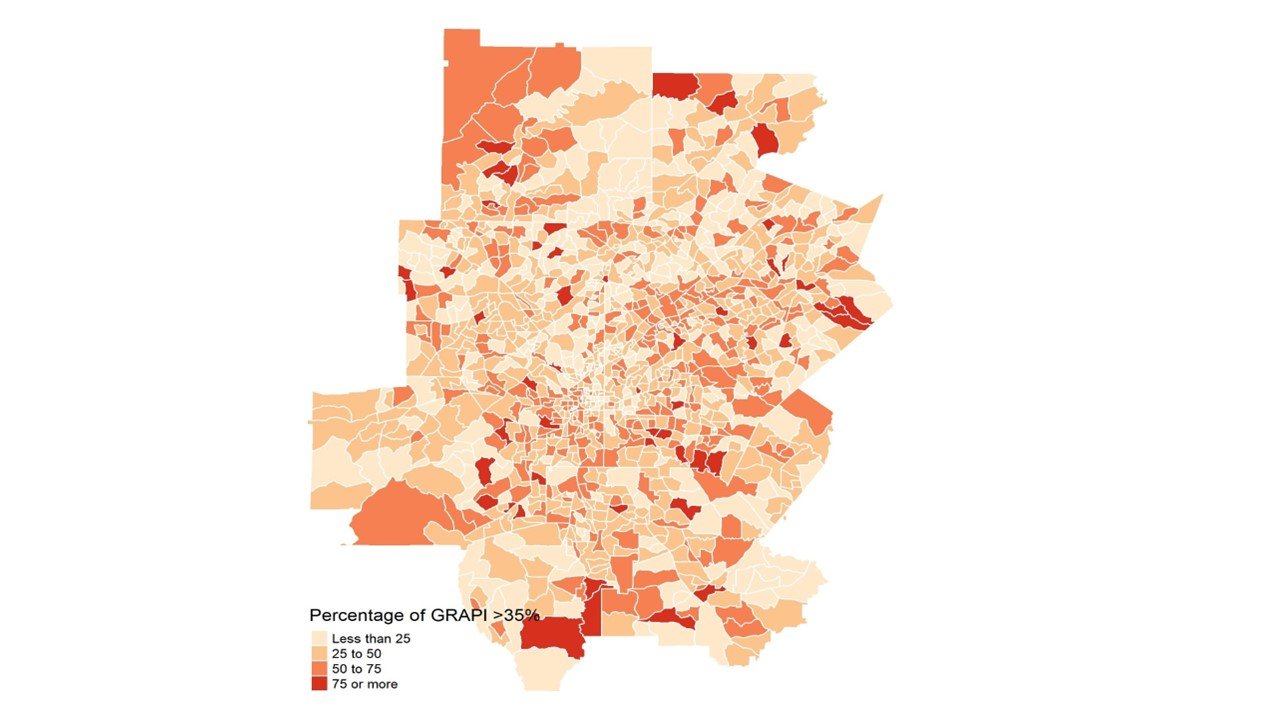
Given the fact that detailed data on energy bill has not yet been made accessible, we use the gross rent as a percentage of household income (GRAPI) as a proxy to estimate potential energy burdens for renters. Figure 2 below illustrates percentages of households with a GRAPI greater than 35%. More than one-third of census tracts in the ARC region have more than half of their households living with housing and potential energy burdens. Counties with highest percent of GRAPI>35% include Clayton (42.3%), DeKalb (42.2%), and Gwinnett (40.2%). Forsyth County (33.2%) and Fayette County (31%) are among the lowest, though they still include subareas with a substantial portion heavily impacted.
Figure 2: Percentage of Population with a Gross Rent As a Percentage of Income (GRAPI) > 35% in Atlanta 5-county Region (Data Source: American Community Survey, 5-year Estimate)
The Unhoused: Eviction and Homelessness
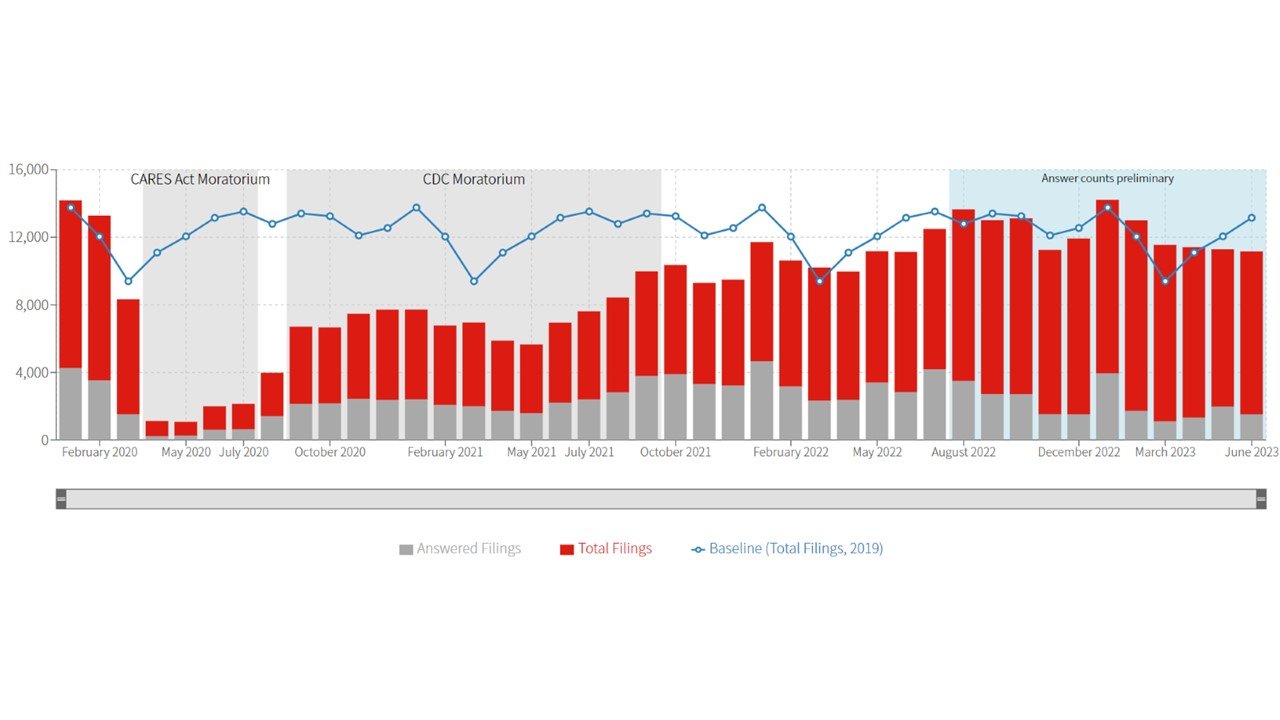
A more hidden cause of heat vulnerability that could potentially leave many baking in heat waves is the absence of a permanent residence. Since the outbreak of the pandemic, eviction cases have been rising despite the CDC Moratorium, as Figure 3 illustrates. According to ARC’s Atlanta Region Eviction Tracker, in June 2023 alone, 11,159 eviction filings are reported in the 5-county region (Fulton, Clayton, Gwinnett, Cobb, DeKalb), of which 1,518 (13.6%) have been answered. Overlaying with other socioeconomic characteristics such as disability and age, being evicted in the mid-summer can be a life-threatening event.
Figure 3: Monthly Eviction Filings in Atlanta 5-county Region (Source: ARC Atlanta Eviction Tracker)
Homeless people all across the country, including in the Atlanta region, face more extreme heat exposure than any other group. With limited access to water and shelter, extreme heat exposure can have fatal consequences. In other regions, like Maricopa County (home to Phoenix, Arizona), unhoused people accounted for about 40% of the 425 heat-associated deaths, during its hottest summer on record this year (Machowicz & Snow, 2023). Additionally, according to Climate Scientist David Hondula, the unhoused are also about 200 times more likely to die from heat-associated causes than sheltered people (Harris, 2022), showcasing, in numbers, the effect not having housing can have on heat-related illness risk.
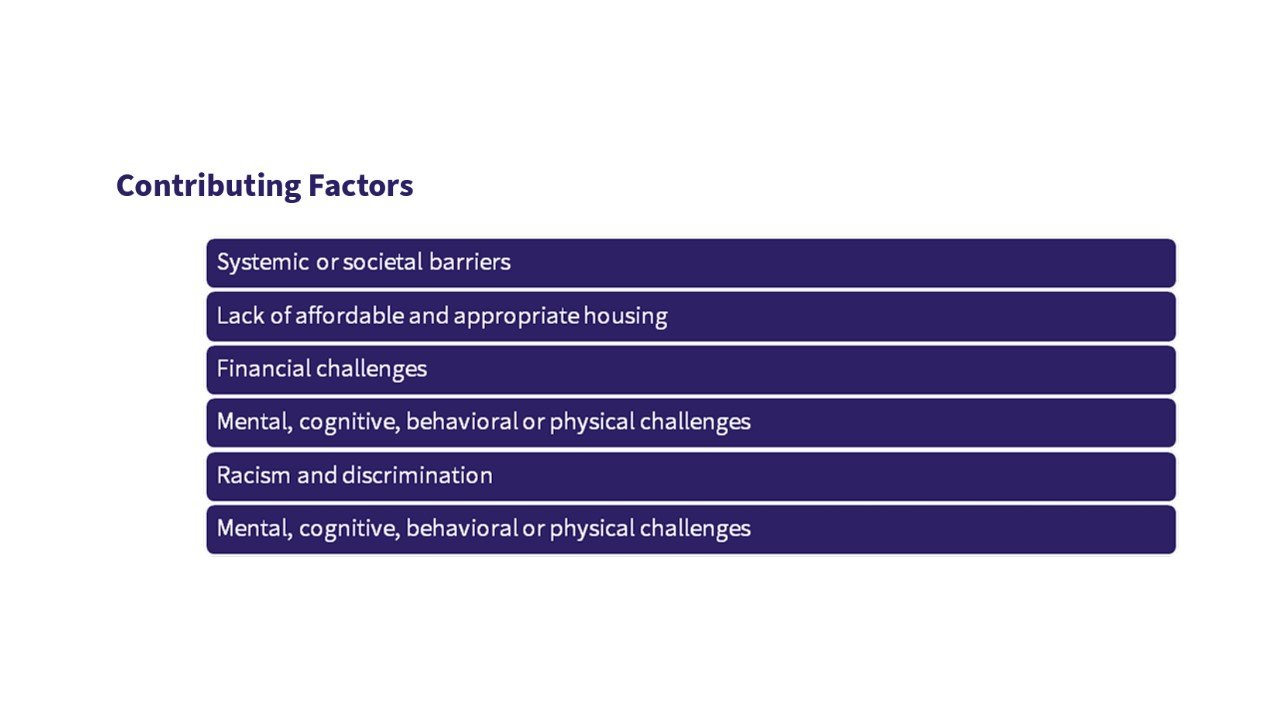
To quantitatively assess the risk our unhoused population faces, we need to address a few factors to frame homelessness. Homelessness has many definitions across different agencies and fields, but generally, homelessness refers to the experience of lacking permanent night-time shelter. There are also different types of homelessness, that are deeply correlated with factors such as disability, age, and the network of people surrounding the individual (e.g. if a family unit is homeless, or if there are family members or friends willing to give temporary shelter). These risks also affect the “hidden homeless”: those who have temporary shelter due to friends or family. Figure 4, taken from A Plan to Address Hidden Homelessness in Henry County, gives an overview of the contributing factors to homelessness.
Figure 4: Contributing factors to homelessness (Source: Henry County Housing Study)
Each of these factors can contribute in their own way to heat vulnerability, but combined they can be devastating. These factors only tell a part of each individual’s story, too – every individual person has their own specific set of circumstances contributing to housing status. There are multiple types of housing support stages -depicted here in this Figure 5, also from A Plan to Address Hidden Homelessness in Henry County. This chart is a summary of housing and wrap around services1 based on how long each stage supports an individual, and the type of services that stage provides.
Figure 5: Housing and Wrap Around Services (Source: Henry County Housing Study)
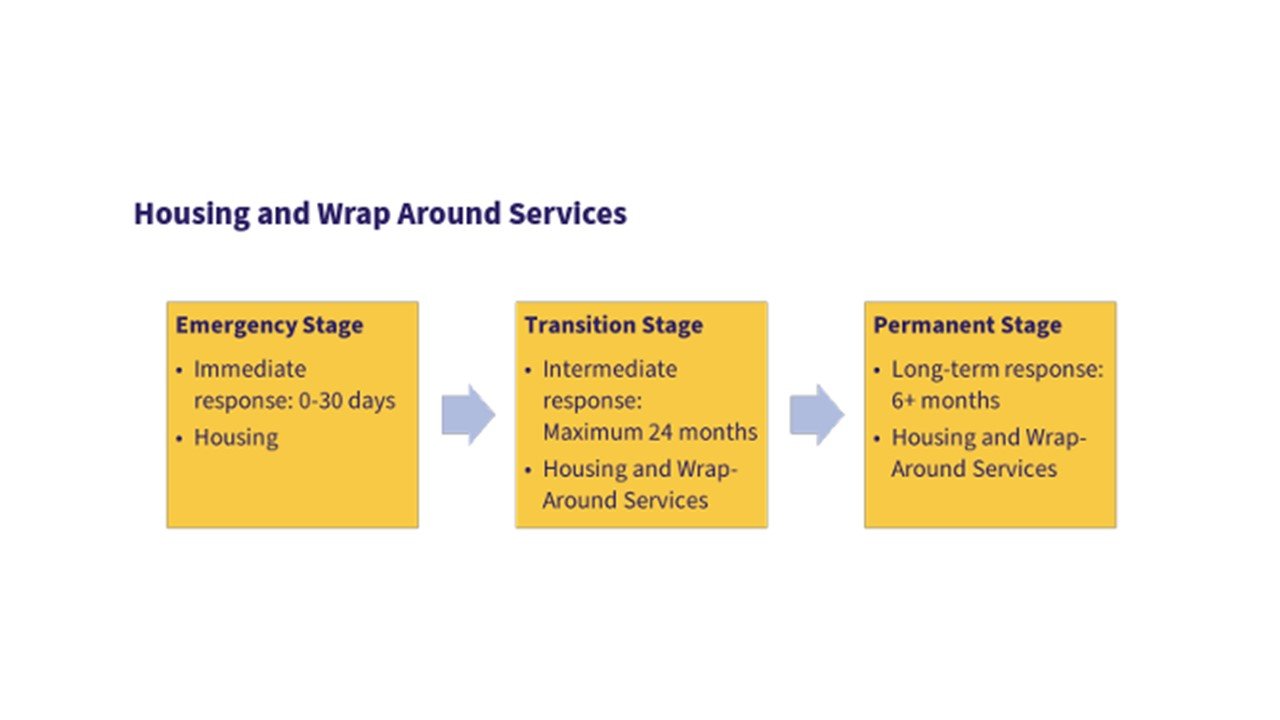
Emergency stages include a variety of examples, but one of which is the classic type of shelter, often providing a bed, a bathroom and a window of time one can enter and exit–sometimes only overnight or during emergency situations. Considering the possible amount of extreme heat days projected in this series’ Episode 2, emergency stage housing support may face even more demand. We see that surge happening now in areas like Phoenix, which has faced heat above 110 degrees F this July. High temperatures also mean surfaces like concrete and asphalt can reach temperatures over 180F, causing serious burns if bare skin touches them. (Machowicz and Snow, 2023)
For leaders and policy makers, it can be difficult to assess the resources needed, as most homeless people simply do not want to stand out, due to there being a high risk of violence against them (Kushel, 2022). Thus, counting them is difficult, and determining what type of resources and how many resources people need. However, we do have more data on heat-related illness and that risk, and how to curb those risks are well-documented.
References:
IPCC (2012). Determinants of risk: exposure and vulnerability. In: Managing the Risks of Extreme Events and Disasters to Advance Climate Change. A Special Report of Working Groups I and II of the Intergovernmental Panel on Climate Change (IPCC). Cambridge University Press, Cambridge, UK, and New York, NY, USA, pp. 65-108.
Brooks, N. (2003). (working paper). Vulnerability, risk and adaptation: A conceptual framework (pp. 1–16). Tyndall Centre for Climate Change Research.
Machowicz, T., & Snow, A. (2023, July 28). Homeless struggle to stay safe from record high temperatures in blistering Phoenix. AP News. https://apnews.com/article/homeless-heat-phoenix-climate-a47f04ee21b96651585f3684ac35cb6e
Harris, T. (2022, June 25). Heat-associated deaths especially common for people without homes. The Weather Channel. https://weather.com/safety/heat/news/2022-06-25-excessive-heat-impacts-homeless-people
Kushel, M. (2022, July 14). Violence against people who are homeless: The hidden epidemic. Benioff Homelessness and Housing Initiative. https://homelessness.ucsf.edu/blog/violence-against-people-homeless-hidden-epidemic

