Get your sunscreen ready! Atlantans could have anywhere from a week to a month’s worth of days with a maximum of over 105 degrees Fahrenheit by 2050, depending on how we manage our emissions. Atlanta’s only one of many metros — nationwide, though especially in the South– where “global warming” is expected to deliver an average of 20 extra days of triple digit heat per year. (John Muyskens et al., 2022). As the frequency of extreme temperatures increases, so will our use of electricity to deal with the heat, frequency of extreme weather events, and our risk of heat-related illness.
In our previous episode we established metro Atlanta’s historical heat trajectory, and it wasn’t pretty. With that in mind, we can then start analyzing projections for the region – what can we and our children expect to face in the future? To the point: it’s only getting hotter. That much is unavoidable. However, how much hotter it’s going to get is highly variable and depends primarily on our level of greenhouse gas (GHG) emissions.
How do we project the trends of “more heat” that we established in Episode 1 will continue into 2030-2099? Using the Coupled-Model Intercomparison Project Phase 5 (CMIP5) simulation[1], the U.S. Global Change Research Program (USGCRP) established a county-level extreme heat day projection for three forecast periods under two emission scenarios:
- The lower emissions scenario, meaning the averages from 32 model simulations under the Representative Concentration Pathway (RCP)[2] 4.5 scenario
- The higher emissions scenario (32 simulations) using the RCP 8.5 scenario.
Those model simulations can be statistically represented in several ways, two of which include (A) the number of days with a maximum/minimum temperature above a certain threshold (like extreme heat days), or (B) a pair of Climate Normals[3]: the average daily maximum/minimum temperature. Something to keep in mind is averaging out temperature projections on a decadal (10-year) scale is typically best practice due to the natural variability of the climate on an annual scale (year to year). They can also be useful at a variety of geographic scales.
Let’s start with (A) the maximums and minimums above a threshold.
Figure 1: Georgia Counties: LOW Emissions Scenario – “Extra Heat Days” by 2045 [Source: U.S. Global Change Research Program (USGCRP), ARC Research and Analytics Department (RAD) Analysis]
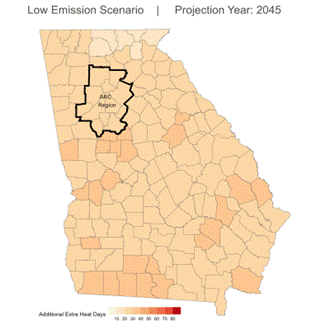
Figure 2: Georgia Counties: HIGH Emissions Scenario – “Extra Heat Days” by 2045 (Source: U.S. Global Change Research Program (USGCRP), ARC RAD Analysis)
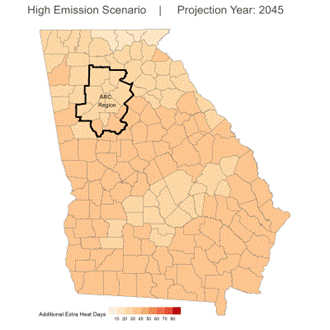
Figure 1 (above) illustrates additional extreme heat days that counties in Georgia will experience cumulatively at the end of each forecast period (2045, 2065, 2099). Even under the low emission scenario of Figure 1, counties in Georgia are expected to experience more than 20 additional extreme heat days by just 2045. Horizontally, this forecast model clearly indicates the impact of greenhouse gas emissions on extreme heat weather. If the high emission scenario (Figure 2) transpires and is sustained beyond 2045 (as shown) to 2099, ARC counties will experience more than 80 extreme heat days– an entire summer by itself. Roughly ¼ of the year being extreme heat days is almost impossible to have a reference for, given our relatively few extreme heat days now. You might be wondering, though, this is the south; I should just move elsewhere to escape this, right? Figure 2 tells it straight: Long story short, for summer, there is no escape from high temperatures, in general.
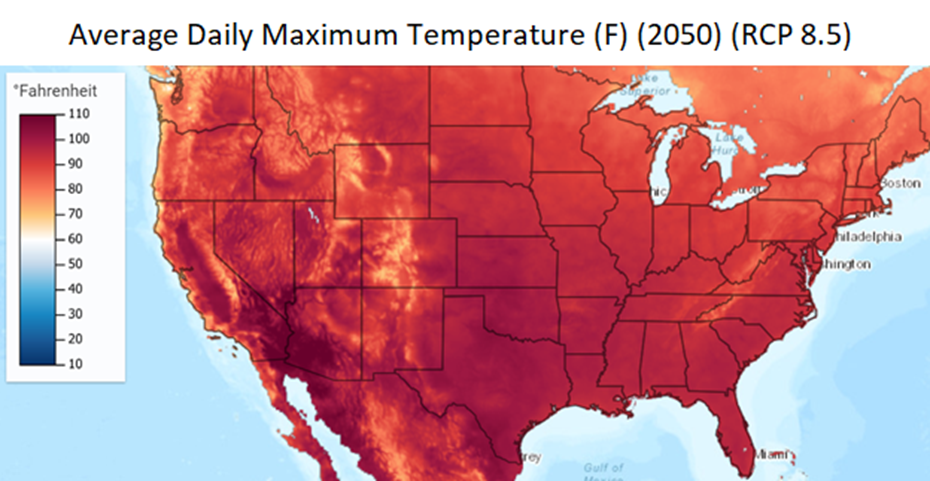
Now let’s move on to look at some results from that (B) method above—projected average daily maximum temperature. Figure 3 below shows our lower emissions (RCP 4.5) scenario for the nationwide summer of 2050. Figure 4 then follows, below, to illustrate the higher emissions (RCP 8.5) scenario using the same scale. More specifically, these images showcase the projected average daily maximum temperature for the continental US in the summer of 2050 – we see the average will be well above 90F, nearing 100F, often.
Figure 3: Nationwide Projections: LOW Emissions Scenario- Average Daily Temperatures 2050 (Source: U.S. Global Change Research Program (USGCRP), ARC RAD Analysis)
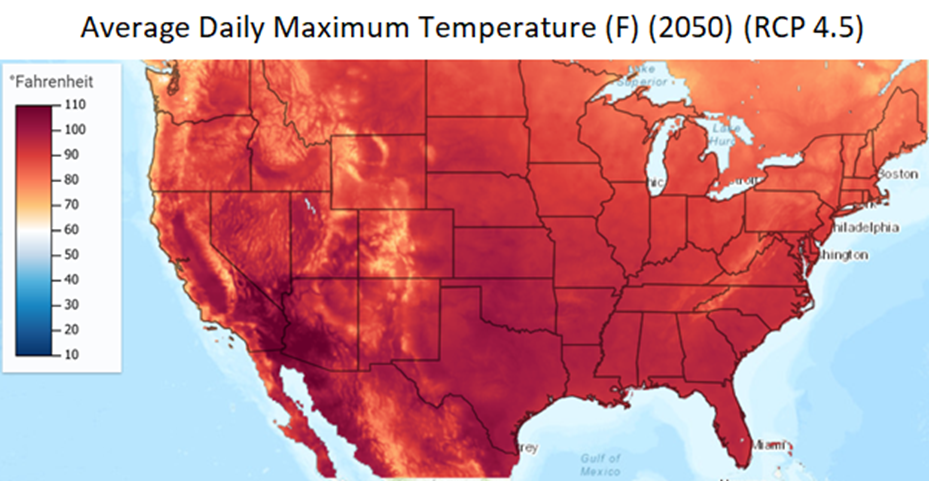
Figure 4: Nationwide Projections: HIGH Emissions Scenario- Average Daily Temperatures 2050 (Source: U.S. Global Change Research Program (USGCRP), ARC RAD Analysis)
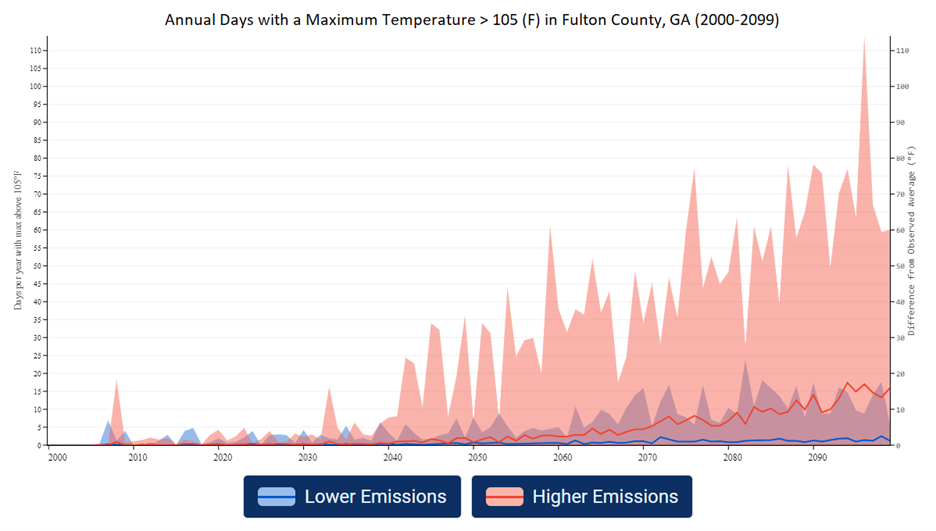
Other ways to frame heat projections include, as opposed to piecing together a state county-by-county to take a broader look (like in Figure 1), and then focusing in on different temperature thresholds. Here’s the days-per-year that’re projected to reach a daily maximum of 105 in Fulton County, starting from the year 2000, and going into 2099. In Figure 5 below, the blue line indicates a low emissions scenario, and the red indicates a high emissions scenario.
Figure 6 below lets us see the higher emissions scenario line up with our previous analysis for GA in Figure 1–and for Fulton County in particular. We see daunting conditions, with the Fulton highs hitting a maximum temperature above 105F for as many as 110 days or more per year by the 2090s . One can see visually the differences between a low emission scenario vs a high one, as the low emissions maximum is <25 days with a maximum temperature above 105F. A third of a year vs less than a month is the big difference that constraining emission levels (from high to low) might make.
Figure 5: Fulton County: Projected Annual Days 2000-2099 with MAXIMUM Temperature of Over 105 Degrees: (Source: U.S. Global Change Research Program (USGCRP), ARC RAD Analysis)
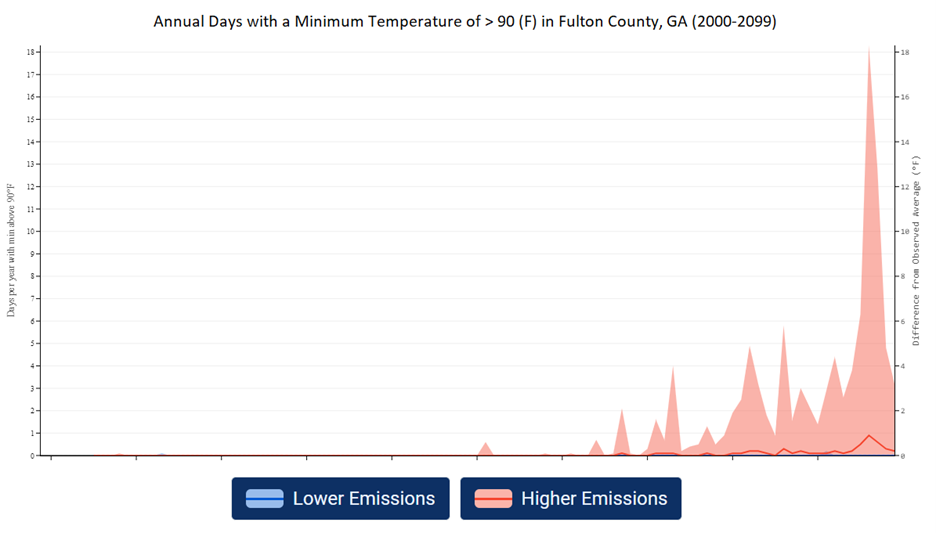
Showcasing this further, we have Figure 6. The chart here showcases days with a minimum temperature of 95F. As we can see, this simply is not much of a concern in the low emissions scenario, whereas Fulton County can look forward to as many as 18 days, almost 3 weeks, of a 95 week minimum in the 2090s high emissions scenario.
Figure 6: Fulton County: Projected Annual Days 2000-2099 with MINIMUM Temperature of Over 90 Degrees: (Source: U.S. Global Change Research Program (USGCRP), ARC RAD Analysis)
So to sum things up, then! We can measure and project with a variety of measurements, timescales, geographic scales. We can also visualize this with as many charts, maps, and figures as possible. But the present reality is that heat is rising, and this is the almost certainly the coldest period for the rest of our lives. We can, however, still make a big difference, depending on how we manage our emissions. What does this mean, though? So what if it gets hot? How does this affect a city like Atlanta, a neighborhood like Old Fourth Ward, or an individual? Heat related illnesses and vulnerable populations are going to be covered in Episode 3 of this Summer Series!
Notes:
[1] By “coupling” together factors in a mathematical model (most notably here, emissions and heat), we can project the range of temperatures depending on emission levels.
[2] A GHG concentration trajectory dependent on the volume of GHG emissions. A prediction of the future for a bunch of different emissions scenarios, essentially.
[3] Climate Normals are 30-year averages that are used as a baseline to evaluate changes relative to that baseline. “It’s normally [x climate conditions] – how is right now or later on going to be different?”

