
In a previous blog post, we used the Census Bureau’s Small Area Health Insurance Estimates (SAHIE) to examine health insurance coverage rates in Georgia over time and saw how the Affordable Care Act (ACA) helped decrease the number of uninsured Georgians. As noted, however, the impact would likely be different for different subgroups. We introduce a new visualization to allow deeper investigation of by age and income at the county level.
A reminder about the data: every year since 2008, the Census Bureau has supplemented American Community Survey (ACS) data with administrative data such as Medicaid and Children’s Health Insurance Program (CHIP) participation records and aggregated tax return data to produce allowing production of single-year estimates for all counties in the United States. By contrast, only 37 of Georgia’s 159 counties meet the 65,000-population threshold to receive single-year ACS estimates [1].
Figure 1 provides the example of Fulton County, for all ages (64 and under) [2].
Figure 1: Fulton County, All Ages Insurance Coverage Rates from 2008-2021 (Source: SAHIE, ARC RAD)
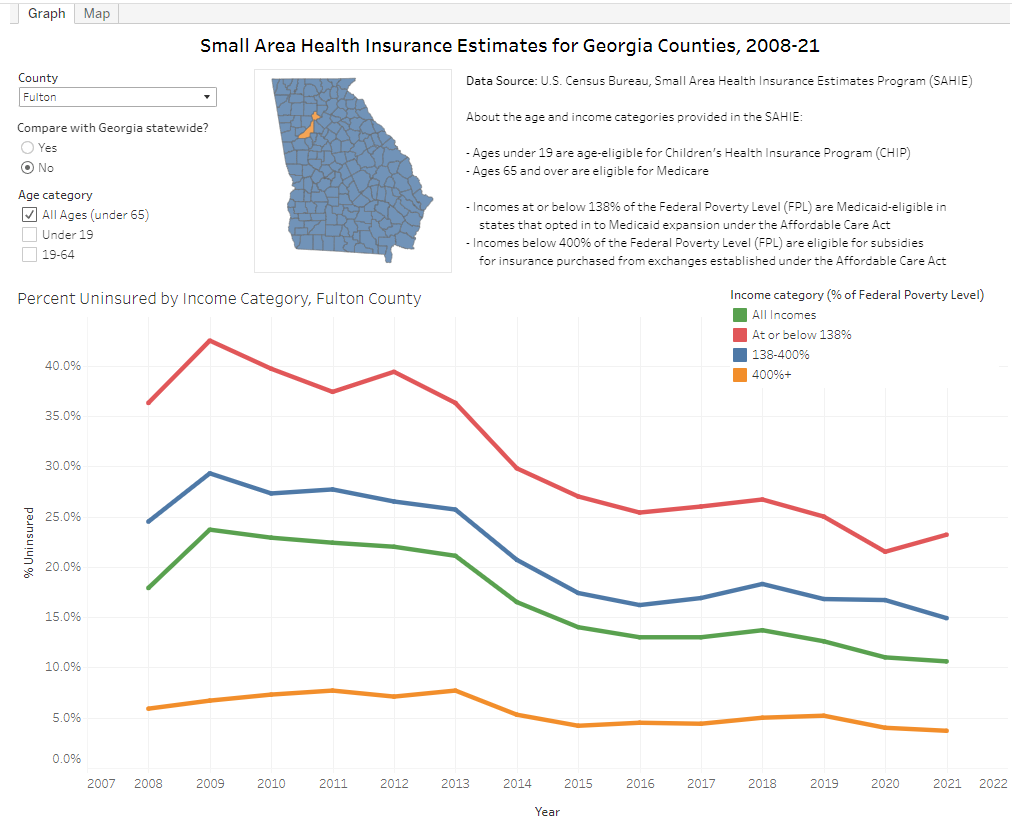
The visualization breaks the population into three income subgroups: at or below 138% of the Federal Poverty Level (FPL)[3], the income group that might receive Medicaid; 138%-400% of FPL, the income group that would not be income-eligible for Medicaid, but that could qualify for a subsidy when purchasing health insurance from one of the exchanges created under the ACA; and over 400% of FPL. It also displays a line for all income categories.
As the visualization reveals, the percentage of the population at or below 138% of FPL saw its uninsured population rate peak at well over 40% in 2009, likely due to the Great Recession. People in lower income groups were the most likely to have lost their jobs during the Great Recession; they were also the least likely to have employer-provided insurance and the least likely to be able to afford insurance on the individual private market. The percent uninsured decreased as the economy improved, but the steepest decrease was between 2013 and 2014, when the health exchanges and associated subsidies came into effect. Even with the help of the ACA, however, the uninsured rate never dropped below 20% of this income group. There was also an uptick in the percent uninsured for 2021, possibly the effect of the pandemic job losses in lower income professions.
At the other end of the spectrum, people in households above 400% of FPL have always been insured at much greater rates. The percent uninsured in this income category never exceeded the 7-8% range pre-ACA and dropped to the 4-5% range starting in 2014.
With the exception of the uptick in uninsured for 2021, the line 138-400% of FPL, follows the same trend of the below 138% group. The main difference is that the line is flatter.
Comparing all three groups, we see that the Affordable Care Act has closed– but is far from eliminating– the gap between the three income groups. The at or below 138% group has seen the most improvement in terms of closing that gap, but still also has the farthest to go.
Figure 2 reveals a similar picture if we examine Fulton County for the under-19 age group, and yet there is a difference on one important dimension [4].
Figure 2: Fulton County Insurance Coverage for Residents Under 19, 2008-2021 (Source: SAHIE, ARC RAD)
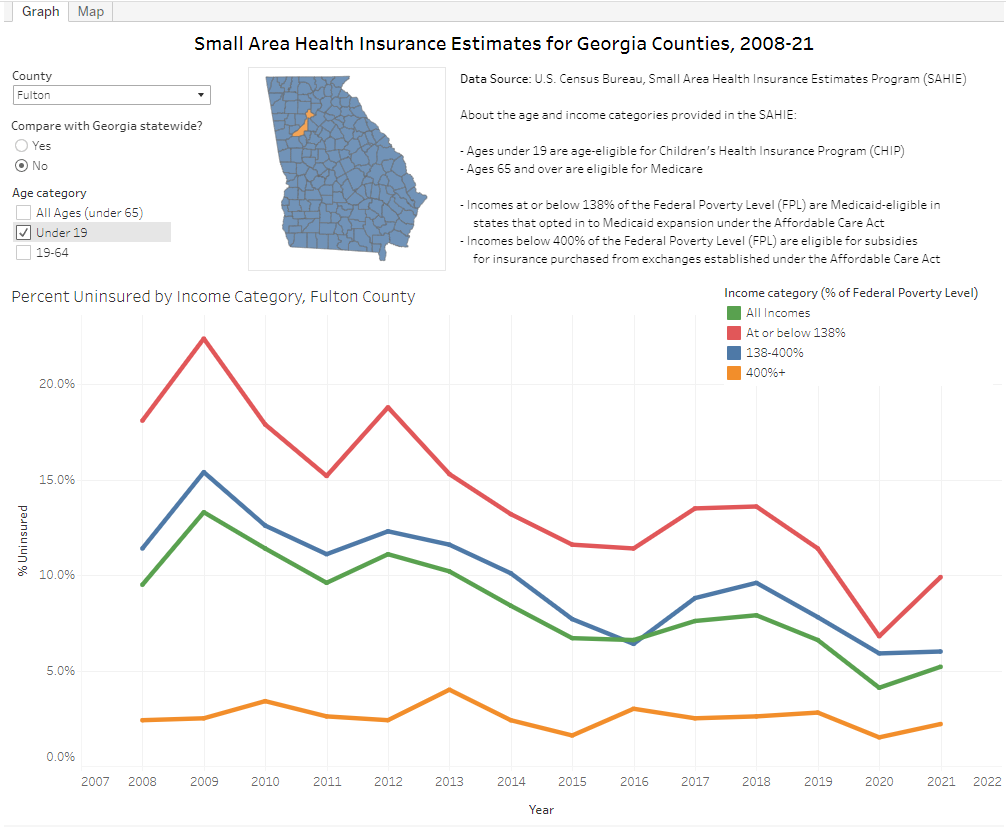
Compared with the population as a whole, the uninsured rates among children are much lower across the time period, even in the pre-ACA period.[5] We still see a sizable decrease in percent uninsured between 2013 and 2014, and some closing of the gap between the two lower income groups and the higher income group.
The visualization also offers a second tab with a map, where you can examine the spatial pattern of percent uninsured within an income category/age category pair, for any year covered by the data. Below (in Figure 3) are two examples of this from 2021, side by side for comparison.
Figure 3: Fayette County Heath Insurance Coverage 2021, Total and Lower-Income (Source: SAHIE, ARC RAD)
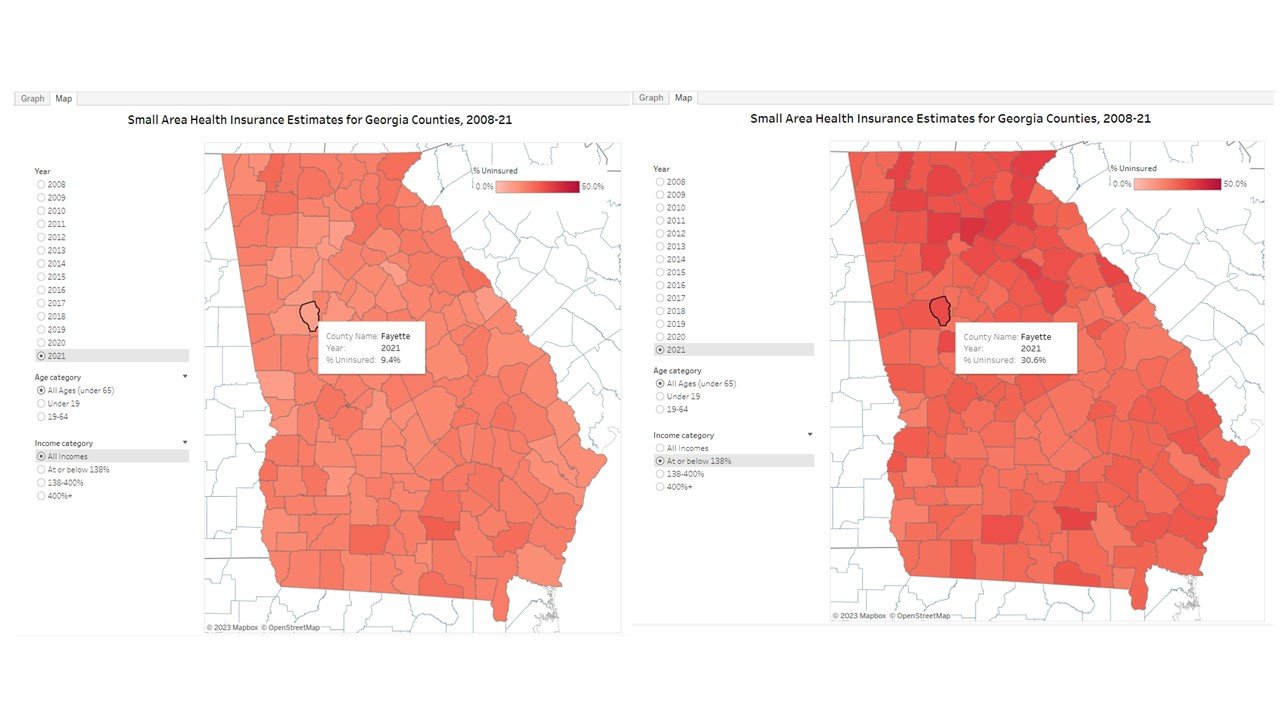
For example, we can see that in 2021 Fayette County had the lowest rate statewide of uninsured population at 9.4%, but that at 30.6%, it had one of the top rates of uninsured population among people with incomes at or below 138% of FPL [3].
Want to explore further? You can access the visualization here: https://public.tableau.com/app/profile/moshe.haspel/viz/GeorgiaSAHIE/Graph
Footnotes:
[1] For more information about the SAHIE, please see https://www.census.gov/programs-surveys/sahie.html.
[2] The SAHIE only reports for ages 64 and under. Over 98% of the population ages 65 and over have health insurance coverage, thanks to Medicare eligibility which kicks in at age 65.
[3] Federal poverty guidelines are published in the Federal Register each year by the Department of Health and Human Services and are a joint function of the income and the size of a family or household. For the 48 contiguous states and the District of Columbia, the 2023 poverty guideline for a single-person household was $14,580, and stepped up $5,140 for each additional person. Thus, FPL in 2023 for a family of four is $30,000, and a four-person household earning $41,400 or less would fall into the at or below 138% category.
[4] Georgia children in families below 247% of FPL are eligible for participation in PeachCare, Georgia’s version of the Children’s Health Insurance Program (CHIP) program. This program provides an opportunity to purchase low-cost health insurance for children whose families are not eligible for Medicaid. Even though 18-year-olds are considered adults for most purposes, children remain age-eligible for this program until their 19th birthday.
[5] The CHIP program, originally known as the State Children’s Health Insurance Program (SCHIP), was a bipartisan initiative co-sponsored by Democrat Ted Kennedy and Republican Orrin Hatch during the Clinton Administration, and predates the ACA by about 15 years.