
For the last time in 2023, we’ve got housing prices on our minds.
The trend of rising housing costs, especially since the onset of the COVID-19 pandemic, has been well established. Prices for new and older homes alike have been steadily increasing in many parts of the country. Over the past few months, we have published blog posts showcasing housing cost dashboards for the following areas:
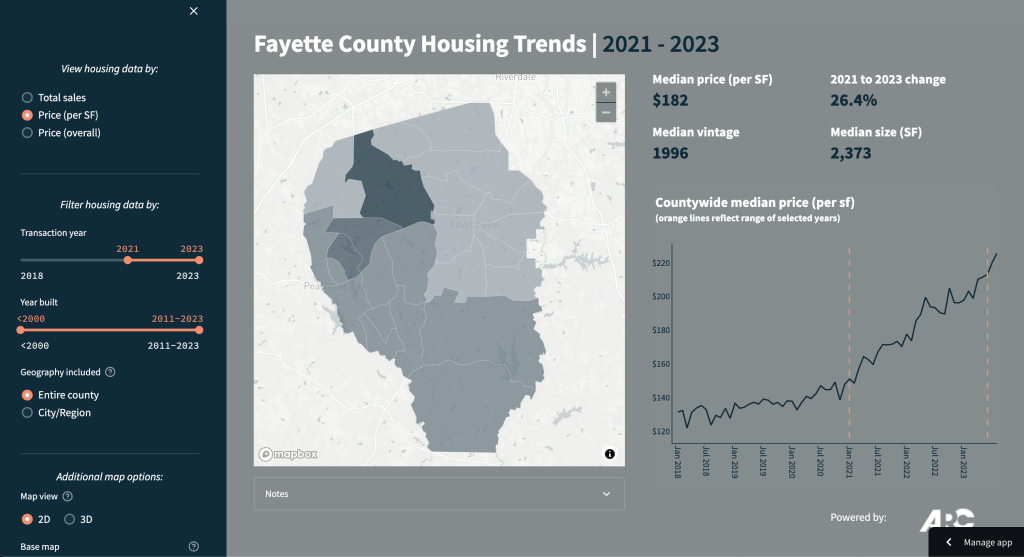
This new dashboard for Fayette County leverages data from the county’s Qpublic public records database which we have collected, geocoded, and aggregated to the Census tract level.
The dashboard (built for desktop, not mobile screens) can be accessed here, and we have included a screenshot of the dashboard below. It features an expandable left-hand side panel with a toggle for the dashboard variable: total sales, median price per square foot, and median overall price. Sidebar sliders allow filtering for transaction time frame, construction vintage of the home, and city/region toggle:
Findings
Here are a few pertinent findings highlighted by the dashboard:
- From 2018 to 2023:
- 14,640 homes sold countywide;
- the overall median sales price countywide during this time period was $377,000, while the median price per square foot was roughly $157.
- the median sale price per square foot rose nearly 60%, with much of this increase occurred since the onset of the COVID-19 pandemic.
- The peak price per square foot occurred in the most recent month of available data (August 2023) with a countywide median of $226.
- This countywide median price dipped during Q3 of 2022 but has steadily increased since that time
- Since the onset of the pandemic (i.e., 2020 – present):
- Over 9,500 homes have sold countywide;
- the overall median sales price was $408,604;
- the median sale price per square foot was roughly $172 and rose by just over 45%.
- Homes sold in just the Fayetteville sub-geography (Census tracts in the northeast portion of the county) from 2018 to 2023 featured a median vintage of 1996.
- Since only the onset of the pandemic, most of the homes of new construction vintage (built since 2011) have sold in the Census tract south of the downtown area (13-113-140405), where a total of 181 such homes have sold.
- Isolating just homes built since 2000 in the Fayetteville market (924 in total), the median price per square foot has risen since 2020 to the present, at a total change of 48.5% over that time frame.
- When toggling on the 3D view of the map and expanding the sidebar sliders to include all sale years, look at homes sold that were built prior to 2000:
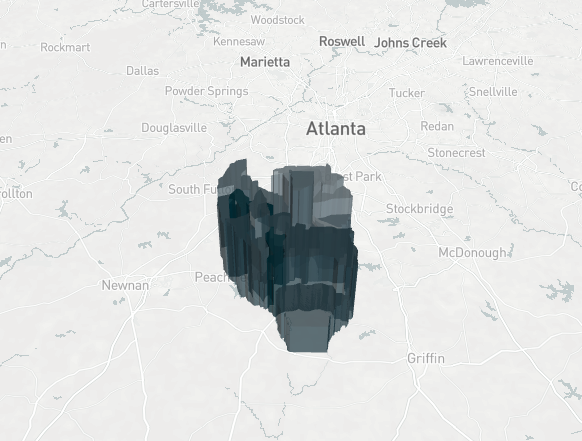
-
- We see a fairly even geographic distribution of homes sold of an older vintage. Now, when toggling sales for homes built since 2000, we see quite a different picture:
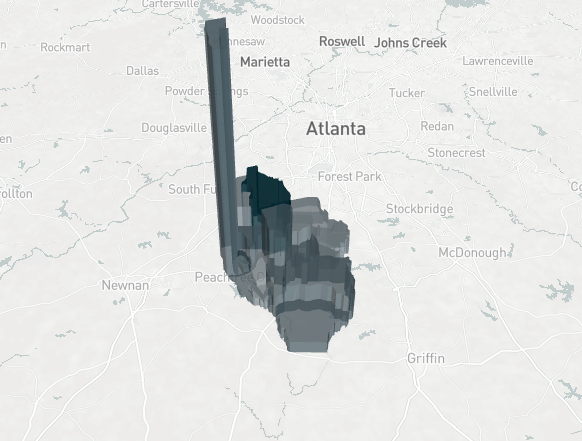
-
- The obvious outlier is in the West Fayette sub-geography and is Census tract 13-113-140210. For homes built since 2000, this Census tract has seen an extraordinary amount of real estate transactions since 2018, with 1,906 sales, which is nearly 1/3 of all countywide sales for that vintage..
- This Census tract features a median sales price per square foot of just over $185 and a median overall sales price of nearly $485,000.
- As high as these prices seem (and compared to countywide median values, they are), neighboring Census tract 13-113-140204 has seen even higher prices since 2018 for homes built since 2000. This Census tract’s median price per square foot is nearly $295, with an overall median sales price of $592,500.
Happy data exploring, and we hope you’ve enjoyed this series of local housing dashboards around metro Atlanta!