
The pandemic has had a cascade of effects that call for rapid decision making, and a huge challenge facing many policymakers and nonprofits is that our go-to data just doesn’t move fast enough to meet the needs of a rapidly changing environment. In recognition of the need for accurate, real-time data on the U.S. economy, the U.S. Census Bureau rapidly designed and launched the Small Business Pulse Survey (SBPS). There are two phases in the data release—one now complete and one planned:
- The first phase of the SBPS (now complete) tracked weekly changes for nine weeks starting in late April and ending in late June; the goal was assessment of COVID-19 impacts on small business operations, including employment, revenue, and supply chain disruption.
- The second phase of the survey, recently authorized by the U.S. Office of Management and the Budget, will provide information on new topics such as small business rehiring of previously furloughed or laid-off employees, the use of online platforms to offer goods and services, and factors that affect capacity and changes in capacity. This phase started August 9th and will continue on a weekly basis until the end of October.
These SBPS data are in many cases unique, but are often a challenge to analyze via the Census webpage. In response, Neighborhood Nexus created and published an interactive dashboard using first phase data to make it easier to track how small businesses in Atlanta fared during the early months of this pandemic.
How has this business been affected by the COVID-19 Pandemic?
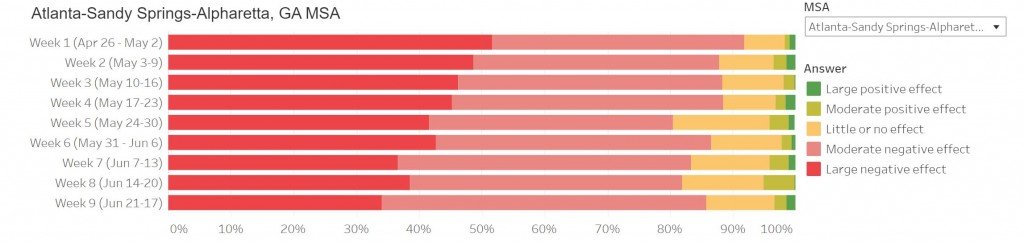
The graph above shows the percent share of respondents who answered “large negative effect“ has gone down over time, while the share of those noting a “moderate negative effect“ has gone up.
The graph to the right illustrates perception changes over the nine weeks in the top 50 MSA regions. The share of “moderate negative effect” responses in Atlanta was above average in week 1, and remained above average for MSAs in week 9 (at the end of the first phase survey).
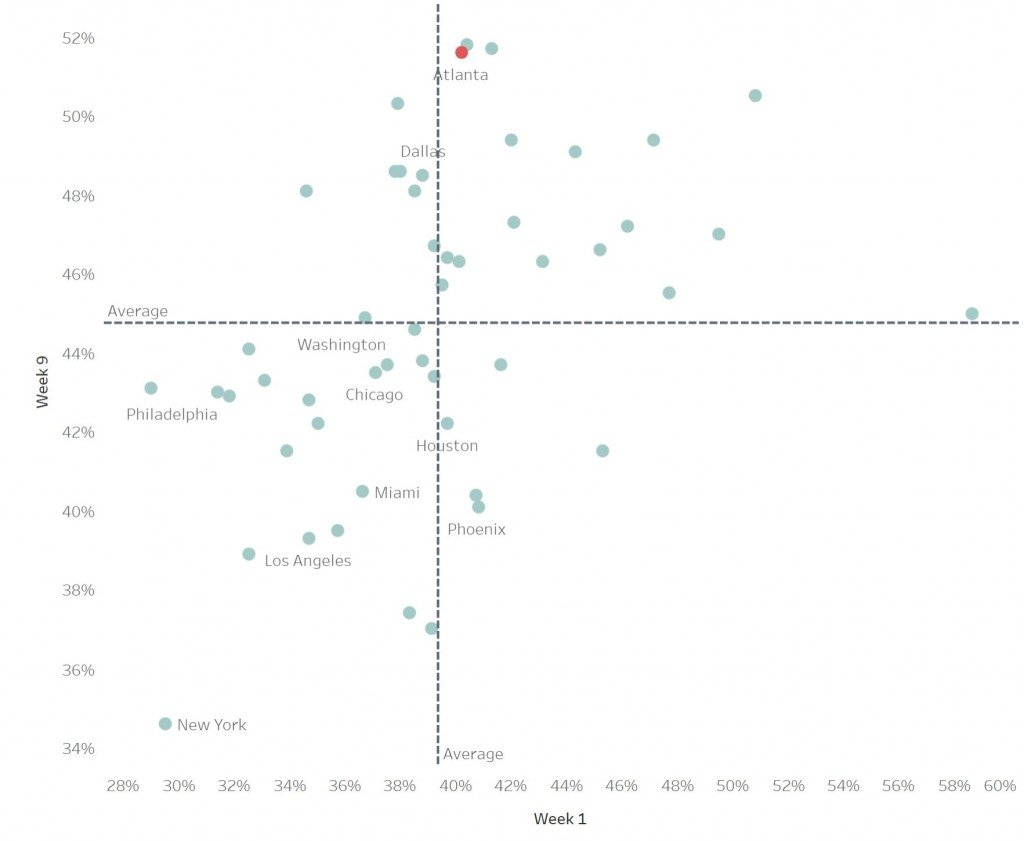
Given that the most frequent response was “moderate negative effect,” Atlanta small business perception of COVID-19 overall impacts are still predominately and consistently negative, though the share of area small businesses feeling a “large negative effect” has declined.
In the last week, did the business experience a change in operating revenues?
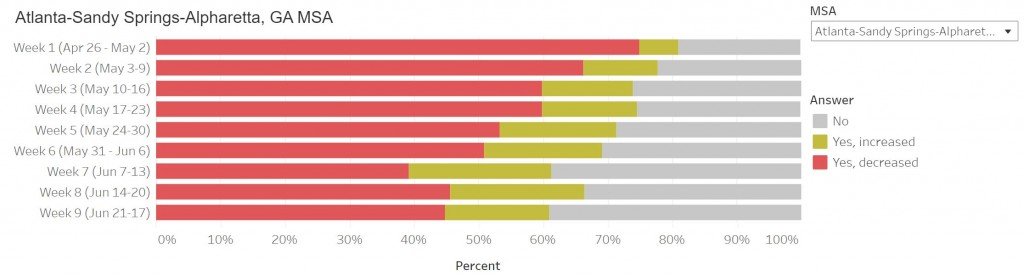
The share of businesses perceiving a “revenue decrease” has decreased over the course of the survey’s first phase. This trend is reflective of the first question’s drop (over time) in the share of businesses feeling a “large negative effect” of the pandemic.
How has Atlanta compared to the other top 50 MSAs? The graph at right shows that share of Atlanta small businesses perceiving a “revenue decrease” was above average across the top 50 MSAs, both in week 1 and in week 9.
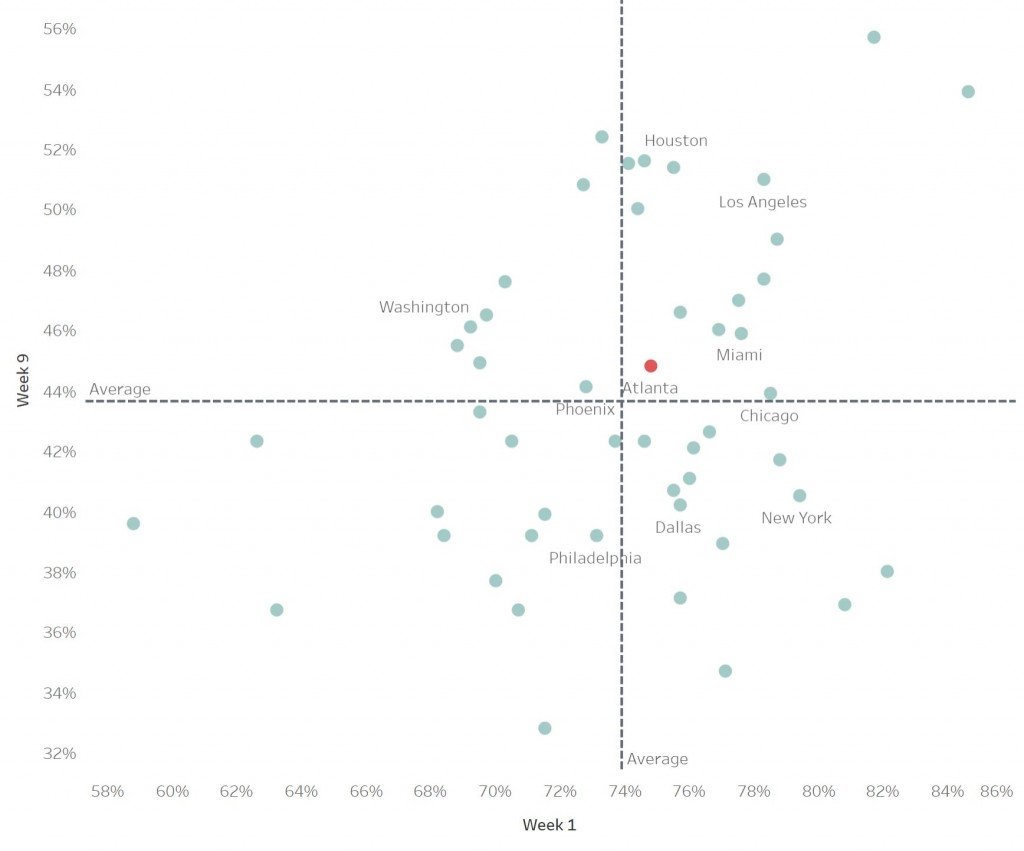
To sum up, fewer Atlanta small businesses (than at the onset of the pandemic) are experiencing a severe revenue drop from COVID-19. However, the pace of small business recovery pace in Atlanta is slower than that in the other top 50 MSAs. Check out the dashboard to see in which MSAs small businesses are recovering faster than they are in Atlanta, among other things.
Other Selected Highlights from the SBPS (First Phase):
- As we got deeper into the pandemic, small businesses in Atlanta have had fewer closures related to COVID-19. Moreover, the small business closure rate in Atlanta is lower than the average closure rate across the top 50 MSAs.
- Most small businesses in Atlanta did not reduce their number of employees, and the share of businesses that cut jobs dropped from late April through July.
- Although more than 50 percent of small businesses reduced employee hours in week 1, the share dropped almost to half. However, the decreases in the worked hours were higher in Atlanta than in other MSAs.
Check out the dashboard for (much) more information.