
Population in an area can potentially grow in three ways: (1) if births exceed deaths (if there is natural increase); (2) if the number people moving into an area, from another part of the country, exceed the number moving out of the area to another part of the country (i.e. if there’s positive domestic migration); (3) if the number of people moving into an area, from outside the country, exceed the number moving out of the area outside the USA (i.e. positive international migration). Here, we take a close look at natural increase, or more specifically, at birth rates. They have been on the decline nationally, lately, and our area’s no different.
While the population of our 21-County region has grown quite a lot in the last couple of decades— with a 44% increase between July 2000 and July 2021 (from 4.3 million to 6.2 million)—the birth rate has actually been in steady decline since 2006. We use data from the Georgia Department of Health’s Office of Health Indicators for Planning (OHIP) to show in Figure 1 that the birth rate in 2021 was 27% lower than it was in 2000.
Figure 1: Birth Rates, 2000-2021: 21-County Region (Source: Georgia DPH OHIP; ARC Research & Analytics)

This decrease is partially attributable to the fact that the Atlanta region is aging: the median age for females in has risen from 33.8 in 2000 to 37.6 in 2020. In fact, the percentage of women in the peak childbearing ages of 20 to 34[1] dropped from 23.8% in 2000 to 20.4% in 2020– a decline of 14%.
The trend for most counties is similar to the one we observed across the region, but Figure 2 reveals some notable exceptions. Forsyth County saw the sharpest decline of birth rates, while the rates in Fayette both started lower than in other counties and then stayed relatively flat. The 2021 birth rate in Hall County was the highest of all counties in the region, and was actually higher than the 2000 birth rate of Fayette and Rockdale counties.
Figure 2: Birth Rates by County, 2000-2021: 21-County Region (Source: Georgia DPH OHIP; ARC Research & Analytics)

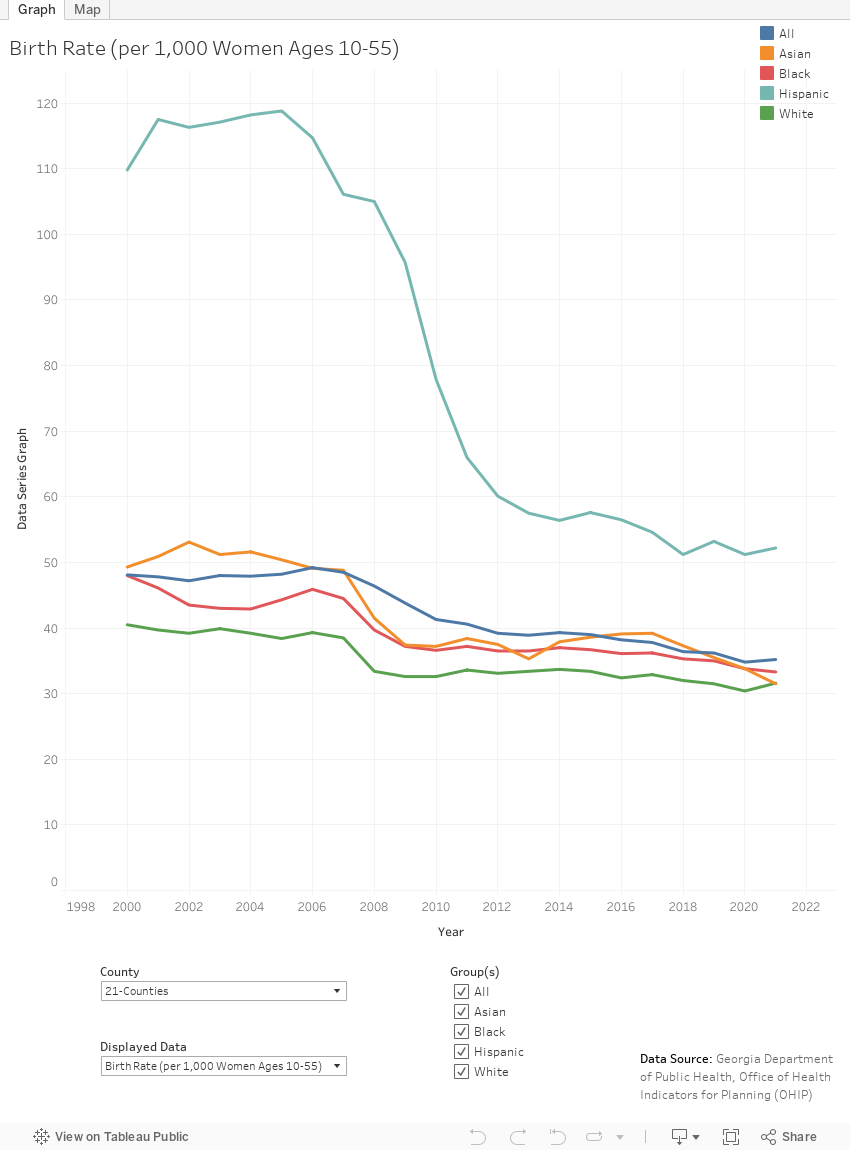
Some of the differences we observe between counties is likely due to their compositions in terms of race and ethnicity. In particular, as shown in Figure 3 below, the Hispanic or Latino population exhibits a higher birth rate than non-Hispanic Whites, Blacks, or Asians– though that gap has narrowed over the last two decades:
Figure 3: Birth Rates by Race, Hispanic Ethnicity 2000-2021: 21-County Region (Source: Georgia DPH; ARC Research & Analytics)

A similar picture emerges if we examine the ratio of births to deaths each year for our region, again using data from OHIP. Figure 4 below shows that in the early 2000s, the region had about 2.8 births for every death. That ratio began its downward trend at the start of the Great Recession, and showed a sharp drop during the pandemic years down to just 1.4 births for every death—half the ratio of the early 2000s.
Figure 4: Births to Deaths Ratio by Year: 21-County Region (Source: Georgia DPH OHIP; ARC Research & Analytics)

The upshot of all this is that. with relatively low birth rates, in-migration (domestic or international) will likely be a key factor in continued growth for our region.
Want to explore further on your own?
We have prepared an interactive Tableau visualization (click on the image below) that permits examination of these data by county as well as by race and ethnicity.
[1] According to the 2021 American Community Survey 1-year estimates, the birth rate was 84 per 1,000 women 20 to 34 years old, compared with 8 per 1,000 women 15 to 19 years old and 32 per 1,000 women 35 to 50 years old.